
DEA CAPITAL S.p.A.
Registered Office at Via Brera, 21 - 20121 Milan
Share Capital of Euro 306,612,100 fully paid up
Tax Code, VAT reg. no. and Milan Register of Companies no. 07918170015

Notice of
Shareholders’
Meeting
DeA Capital - Annual Financial Statements to 31 December 2014
1

DeA Capital
S.p.A.
Registered Office at Via Brera 21, 20121 Milan
Share capital of EUR 306,612,100, fully paid up
Tax Code, VAT reg. no. and Milan Register of Companies no. 07918170015,
Milan REA (Administrative Economic Register) 1833926
Company subject to the management and co-ordination of De Agostini S.p.A.
NOTICE OF SHAREHOLDERS' MEETING
All eligible persons are invited to attend the Ordinary and Extraordinary Shareholders' Meetings to be held
at Spazio Chiossetto, Via Chiossetto 20, Milan:
- at 10 a.m. on 17 April 2015, on first call;
- at 10 a.m. on Monday, 20 April 2015, on second call,
to discuss and resolve upon the following
AGENDA
Ordinary shareholders’ meeting
1. Appointment of a director. Related and consequent resolutions;
2. Approval of the Annual Financial Statements for the Year Ended 31 December 2014. Partial
distribution of the share premium reserve. Related and consequent resolutions. Presentation of
the Consolidated Financial Statements of the Group headed by DeA Capital S.p.A. for the Year
Ended 31 December 2014;
3. Authorisation to acquire and dispose of treasury shares. Related and consequent resolutions;
4. Amendment to the stock option plan and the performance share plan for 2013-2015 and 2014-
2016. Related and consequent resolutions;
5. Approval of a performance share plan reserved for certain employees and/or directors with
specific duties of DeA Capital S.p.A., its subsidiaries and parent company. Related and consequent
resolutions;
6. Presentation of the DeA Capital S.p.A. Remuneration Report and advisory vote by the
shareholders' meeting on the Remuneration Policy of DeA Capital S.p.A. (section I of the
Remuneration Report), in accordance with art. 123-ter of Legislative Decree 58 of 24 February
1998, as subsequently amended and supplemented;
7. Granting of the mandate for the statutory financial audit for the years 2015-2023, in accordance
with Legislative Decree 39/2010. Related and consequent resolutions.
Extraordinary shareholders’ meeting
1. Amendment of the articles of association in order to introduce loyalty shares, pursuant to article
127-quinquies of Legislative Decree 58 of 24 February 1998. Related and consequent resolutions.
* * *

Presentation of proposals for deliberation/incorporation into the agenda
Shareholders representing, including jointly, at least 2.5% of the share capital may submit a request,
within ten days of this notice being published (i.e. by 28 March 2015), for items to be incorporated into
the meeting agenda, indicating on the request the topics suggested, and may also submit proposals for
resolutions concerning items already on the agenda.
The request, together with the share ownership certificate issued, pursuant to the regulations in force, by
the authorised intermediaries holding the ledgers in which the shareholders’ shares are registered, must
be submitted in writing, by hand or by recorded delivery and by the above deadline, to the Company’s
registered office, for the attention of the Investor Relations department, or sent by email to the address
[email protected], together with information confirming the identity of the shareholders submitting
the request (a contact telephone number should also be provided). Shareholders submitting such requests
must also provide, by the same deadline and by the same means, a report setting out the reasons for the
proposed deliberation/incorporation onto the agenda of new items or further proposals for deliberation of
items already on the agenda. The Company is responsible for notifying shareholders of the incorporation
into the meeting agenda of any new items or proposals for deliberations on existing items, in the
same form as for the publication of this notice convening shareholders’ meetings, at least fifteen days
before the scheduled first-call meeting date. At the same time as publication of the notice confirming
incorporation into the agenda of new items or proposals for deliberations on existing items, the proposals
for incorporation/deliberation, together with the corresponding reports submitted by the shareholders
concerned and any opinion of the Board of Directors, must be made public pursuant to art. 125-ter,
paragraph 1, of Legislative Decree no. 58/1998.
With the exception of proposals relating to the subject areas listed in art. 125-ter, paragraph 1, of
Legislative Decree no. 58/1998, no additions may be made to the agenda if they relate to matters which,
by law, must be decided by the shareholders’ meeting at the proposal of the Board of Directors or on the
basis of a plan or report prepared by the same.
Right to ask questions about items on the agenda
All holders of voting rights may raise questions about items on the agenda, including in advance of the
meeting. Any questions, together with the share ownership certificate issued, pursuant to the regulations
in force, by the authorised intermediaries holding the ledgers in which shareholders’ shares are registered,
must be sent to the Company’s registered office (see the section “Registered Office” in this notice) for the
attention of the Investor Relations department, by recorded-delivery letter, by fax to the number +39 02
62499599 or by email to the address [email protected]. Questions must be received by the Company before
close of business on the third day before the scheduled meeting date (i.e. by 14 April 2015). Provided
that questions are received before the meeting and by the requisite deadline, a response will be provided,
at the latest, during the meeting itself; a response is deemed to have been provided at a meeting if it
is made available, on paper, to each of those entitled to vote at the start of the meeting. The Company
may provide a single response to questions with the same content. The Company also reserves the right
to provide the information requested by any questions received prior to the shareholders’ meeting by
displaying it on a dedicated “Questions and answers” page which can be accessed through the Company’s
response need be given at the meeting.

Right to take part in meetings
Shareholders are eligible to take part in shareholders’ meetings if they are registered as holding voting
rights on the record date - i.e. by the close of business on the seventh trading day before the date
scheduled for the first-call meeting (8 April 2015) - and if the requisite statement has been received from
the authorised intermediary by the Company. Individuals who only become shareholders after that date will
not be entitled to take part or vote in the shareholders’ meeting.
The statement by the authorised intermediary referred to above must be received by the Company before
close of business on the third trading day prior to the date scheduled for the first-call meeting. If the
statement is received by the Company after this date, shareholders will, however, still be entitled to take
part in the meeting and vote provided the statement is received before the start of the first-call meeting. It
should be remembered that the statement is communicated to the Company by the authorised intermediary
at the request of the individual holding the voting right.
Representation in meetings
All those entitled to take part in a meeting may appoint a representative by issuing a written proxy in
accordance with the statutory and regulatory provisions in force. In this regard, it should be noted that a
proxy may be granted with a digital document in electronic form, as defined in art. 135-novies, paragraph
6, of Legislative Decree 58/1998, and that the proxy-letter template provided at www.deacapital.it may
be used for this purpose. The proxy may be sent to the Company by recorded delivery to the Company's
The proxy holder may provide or send a copy of the proxy to the Company instead of the original, certifying
on his/her own responsibility that it is a true copy and confirming the proxy-giver's identity. Any advance
notification does not release the proxy holder from the obligation to certify that the proxy is a true copy
and to attest to the identity of the proxy-giver when he/she confirms his/her eligibility to take part in the
shareholders’ meeting.
Designated proxy holder
Proxies, with voting instructions for the items on the agenda, may be granted to Computershare S.p.A.,
which has its registered office at Via Lorenzo Mascheroni 19, Milan 20145, duly designated by the Company
for this purpose, in accordance with art. 135-undecies of Legislative Decree 58/1998; a printable version of
the relevant form to be signed may be downloaded from the website www.deacapital.it (under the section
Corporate Governance/Shareholders’ Meetings) or obtained from the Company’s registered office or from
the registered office of Computershare S.p.A. The original of the proxy, with voting instructions, must be
received by Computershare S.p.A., Via Lorenzo Mascheroni 19, Milan 20145, by close of business on the
penultimate trading day before the date scheduled for the first-call meeting or for any second-call meeting
(i.e. by 15 April 2015 for the first-call meeting or by 16 April 2015 for the second-call meeting). A copy
of the proxy, accompanied by a statement confirming that it is a true copy of the original, may be provided
to the designated proxy holder by the above-mentioned deadlines by fax to +39 02 46776850, or appended
to an email sent to the address [email protected]. The proxy is valid solely in respect of
those items for which voting instructions are given. Proxies and voting instructions may be revoked by the
deadlines specified above. Note that the statement to be communicated to the Company by the authorised
intermediary, confirming the shareholder’s eligibility to take part and exercise his voting rights in the
shareholders’ meeting, is also required if a proxy is granted to the designated proxy holder. By law, shares
for which a proxy is granted, whether in full or in part, are taken into account in determining whether the
shareholders’ meeting is duly constituted, although proxies without voting instructions do not count for the
purposes of calculating the majority and quorum required to pass resolutions. Details of the proxies granted
to Computershare S.p.A. (which can be contacted for any queries by telephone on +39 02 46776811) are
also available on the relevant proxy-letter template mentioned above.
Appointment of a director
Following the departure of a director, the shareholders' meeting, pursuant to art. 11 of the articles of
association, must appoint a new director. Pursuant to art. 11 of the articles of association, if individual
directors are appointed but not the entire Board of Directors, the resolution appointing them must be taken
by the shareholders' meeting with the majority required by law and not in accordance with the voting lists
mechanism, on the basis of proposals made by the shareholders.

Share capital and voting shares
The share capital is EUR 306,612,100 divided into 306,612,100 ordinary shares, each with a par value of
EUR 1.00. Each ordinary share carries voting rights at the shareholders' meeting (except ordinary treasury
shares, which on 16 March 2015 totalled 37,369,276, on which voting rights are suspended in accordance
with the law).
Documentation and information
Please note that documentation relating to the items on the agenda that is required by law or under
regulatory provisions will be made available to the public at the Company’s registered office and published
on the Company’s website at www.deacapital.it (section Corporate Governance/Shareholders’ Meetings)
and on the approved storage site www.1info.it, as well as by the means and under the terms and conditions
laid down in the regulations in force; shareholders and other parties entitled to take part in shareholders’
meetings may obtain copies of this documentation. The following, in particular, will be made available to
the public:
- at the same time as the publication of this notice, the Directors’ Report on points 1, 2, 4, 5 and 7 of the
ordinary shareholders' meeting and the detailed documentation required pursuant to art. 84-bis of the
Issuer Regulations;
- the financial report and other documents referred to in art. 154-ter of the TUF, together with the directors’
reports on the other items on the agenda of the ordinary shareholders' meeting and the sole item on
the agenda of the extraordinary shareholders' meeting, to be made available at least 21 days before the
scheduled meeting date (i.e. 27 March 2015).
All eligible persons have the right to read and, on request, obtain a copy thereof.
This notice is published, pursuant to art. 125-bis of the TUF, on the Company's website (www.deacapital.it),
in the other manners required by law, and as an extract in the newspaper Milano Finanza.
***
Milan, 18 March 2015
For the Board of Directors
The Chairman of the Board of Directors
(Lorenzo Pellicioli)


Corporate Boards
Corporate information
and Controlling
DeA Capital S.p.A. is subject to the management and co-ordination of
De Agostini S.p.A.
Structure
Registered office: Via Brera 21, Milan 20121, Italy
Share capital: EUR 306,612,100 (fully paid up), comprising 306,612,100
shares with a nominal value of EUR 1 each (including 34,985,736
treasury shares at 31 December 2014)
Tax code, VAT code and recorded in the Milan Register of Companies
under no. 07918170015
Board of Directors (*)
Chairman
Lorenzo Pellicioli
Chief Executive Officer
Paolo Ceretti
Directors
Lino Benassi
Rosario Bifulco (1/4/5)
Marco Boroli
Marco Drago
Roberto Drago
Francesca Golfetto (1/3/5)
Severino Salvemini (2/3/5)
Board of Statutory Auditors (*)
Chairman
Angelo Gaviani
Permanent Auditors
Gian Piero Balducci
Annalisa Raffaella Donesana
Deputy Auditors
Annamaria Esposito Abate
Maurizio Ferrero
Giulio Gasloli
Secretariat of the Board of Directors
Diana Allegretti
Manager responsible for preparing the Company’s accounts
Manolo Santilli
Independent Auditors
KPMG S.p.A.
(*) In office until the approval of the Financial Statements for the
Year Ending 31 December 2015
(1) Member of the Control and Risks Committee
(2) Member and Chairman of the Control and Risks Committee
(3) Member of the Remuneration and Appointments Committee
(4) Member and Chairman of the Remuneration and Appointments Committee
(5) Independent Director
DeA Capital - Annual Financial Statements to 31 December 2014
7


Letter to the Shareholders
10
Report on Operations
13
1. Profile of DeA Capital S.p.A.
14
2. Information for shareholders
18
3. The DeA Capital Group’s key Statement of Financial Position
and Income Statement figures
21
Contents
4. Significant events during the year
22
5. The results of the DeA Capital Group
26
6. Results of the Parent Company DeA Capital S.p.A.
63
7. Other information
66
8. Proposal to approve the Financial Statements of DeA Capital S.p.A.
for the Year Ending 31 December 2014 and the partial
distribution of the share premium reserve
76
Consolidated Financial Statements for the
Year Ending 31 December 2014
77
Statement of responsibilities for the
Consolidated Financial Statements
pursuant to art. 154-bis
of Legislative Decree 58/98
139
Information pursuant to art. 149-duodecies
of Consob Issuers Regulation -
Consolidated Financial Statements
141
Annual Financial Statements for the
Year Ending 31 December 2014
143
Statement of responsibilities for the Annual
Financial Statements pursuant to art. 154-bis
of Legislative Decree 58/98
195
Information pursuant to art. 149-duodecies
of Consob Issuers Regulation -
Annual Financial Statements
197
Summary of subsidiaries’ Financial Statements
for the Year Ending 31 December 2014
199
Independent Auditors’ Report
201
Report of the Board of Statutory Auditors
203
DeA Capital - Annual Financial Statements to 31 December 2014
9

Letter
“The net asset value (NAV)
of the DeA Capital Group rose to
EUR 2.41 per share, compared with
EUR 2.30 per share at end-2013.
The sale of our investment in
Générale de Santé allows us
to pay an extraordinary dividend,
while maintaining a solid
financial position”
10 DeA Capital - Letter to the Shareholders

to the Shareholders
D
ear Shareholders,
In Europe, 2014 was a year of still-weak economic
DeA Capital of around EUR 12 million and had a
growth and expectations of the launch of more
positive impact on the NAV.
expansionary monetary policies, a wait that was
rewarded by the ECB in early 2015.
During the year just ended, DeA Capital also
The Italian economy, faced with a marked fall in
continued to focus on developing its activities in
interest rates, has so far only shown timid signs of
the alternative asset management sector, which
recovery, and the financial system is only gradually
generated income of EUR 85 million, and distributed
shaking off the budgetary constraints that have
dividends of EUR 12.5 million to the parent
affected economic activity in recent years.
company.
The equities markets, which had suffered from the
Although conditions are still not ideal for
uncertainties besetting the European economic
fundraising on the Italian market, IDeA Capital
and political framework throughout the entire year,
Funds and IDeA FIMIT are working hard to identify
reacted extremely positively to the announcement
growth strategies, especially thanks to product
of "quantitative easing" and, as early as the first
innovation. The Group's key markets offer attractive
quarter of 2015 began to anticipate a real economic
opportunities in both private equity (e.g. credit,
recovery.
SMEs) and real estate (recovery in property sales/
purchases, stabilising prices and favourable
Thanks to the completion of the first steps in its
new legislation), which can be seized in order to
plan to exit from direct private equity investments,
strengthen the competitive position of the Group's
DeA Capital substantially outperformed the relevant
asset management companies.
stock market indices in the year just ended.
In October, the Group's indirect holding in Générale
de Santé was sold to Ramsay Healthcare and Credit
Agricole Assurances, generating proceeds that
enable the Group to close the year with a positive
consolidated net financial position of EUR 58 million.
The subsequent agreement to sell half of its
investment in Migros to the Anadolu Group at a
price of YTL 26 per share contributed significantly to
the increase in the NAV from EUR 2.30 to EUR 2.41
per DeA Capital share.
The availability of financial resources has therefore
Lorenzo Pellicioli
Paolo Ceretti
enabled the Group to keep to what it promised at
Chairman
Chief Executive Officer
the launch of the plan to sell off direct investments,
and has accordingly proposed to the Shareholders'
meeting that a portion of the share premium
reserve be distributed, at EUR 0.30 per share, or a
total value of around EUR 80 million. DeA Capital
has also re-launched purchases of own shares, with
the intention of creating value for its shareholders
and, if needed, to use them for future investments.
Even now, ahead of completing the exit from the
investment in Migros, the DeA Capital investment
portfolio is already mainly concentrated, on the one
hand, in three companies that operate in real estate
asset management and private equity, and on the
other, investment in funds managed by the Group's
asset management companies. In 2014, the latter
investment generated distributable net income for
DeA Capital - Annual Financial Statements to 31 December 2014
11


Report on
Operations
DeA Capital - Annual Financial Statements to 31 December 2014
13

Profile of
With an investment portfolio of EUR 625 million and assets
under management of EUR 10,500 million, DeA Capital S.p.A. is
one of Italy's largest alternative investment operators.
The Company, which operates in both the Private Equity
Investment and Alternative Asset Management businesses,
is listed on the FTSE Italia STAR section of the Milan stock
exchange, and heads the De Agostini Group in the area of
financial investments.
In the Private Equity Investment business, DeA Capital S.p.A.
has “permanent” capital, and therefore has the advantage -
compared with traditional private equity funds, which are
normally restricted to a pre-determined duration - of greater
flexibility in optimising the timing of entry to and exit from
investments. In terms of investment policy, this flexibility allows
it to adopt an approach based on value creation over
the medium to long term.
In the Alternative Asset Management business, DeA Capital
S.p.A. - through its subsidiaries IDeA FIMIT SGR and IDeA
Capital Funds SGR - is Italy’s leading operator in real estate
fund management and private equity funds of funds programmes,
respectively. The two companies are active in the promotion,
management and value enhancement of investment funds, using
approaches based on sector experience and the ability to identify
opportunities for achieving the best returns.
As Alternative Asset Management focuses on managing funds
with a medium-term to long-term duration, it generates cash
flows that are relatively stable over time for DeA Capital
S.p.A. This, in turn, enables the Company to cover the typical
investment cycle of the private equity investment sector.
14 DeA Capital - Profile of DeA Capital S.p.A.

DeA Capital S.p.A.
PRIVATE EQUITY INVESTMENT
Direct investments
In the services sector, in Europe and
Emerging Europe.
Indirect investments
In private equity funds of funds, co-investment
funds and theme funds.
ALTERNATIVE ASSET
MANAGEMENT
IDeA Capital Funds SGR,
which manages private equity funds (funds of
funds, co-investment funds and theme funds).
1.5 Bn €
Assets under management: EUR 1.5 billion
IDeA FIMIT SGR,
which manages real estate funds.
Assets under management: EUR 9.0 billion
9.0 Bn €
IRE/IRE Advisory,
which operates in project, property and facility
management, as well as real estate brokerage.
For further info:
section: Investements and Asset Management
DeA Capital - Annual Financial Statements to 31 December 2014
15
At 31 December 2014, DeA Capital S.p.A. reported Group
- strategic shareholding in Sigla, which provides consumer
consolidated shareholders’ equity of EUR 653.5 million (EUR
credit for non-specific purposes (salary-backed loans and
629.5 million at 31 December 2013), corresponding to a net
personal loans) and services non-performing loans in Italy.
asset value (NAV) of EUR 2.41 per share (EUR 2.30 per
The investment is held through the Luxembourg-registered
share at 31 December 2013), with an investment portfolio of
company Sigla Luxembourg S.A., an associate of the DeA
EUR 625.0 million (EUR 762.0 million at 31 December 2013).
Capital Group (with a stake of 41.39%).
More specifically, the investment portfolio consists of Private
• Funds
Equity Investment shareholdings of EUR 220.5 million, Private
Equity Investment funds of EUR 203.0 million and net assets
- units in six funds managed by the subsidiary IDeA Capital
relating to the Alternative Asset Management business of EUR
Funds SGR i.e. in the three funds of funds IDeA I Fund
201.5 million.
of Funds (IDeA I FoF), ICF II and ICF III, in the co-
investment fund IDeA Opportunity Fund I (IDeA OF
I) and in the theme fund IDeA Efficienza Energetica
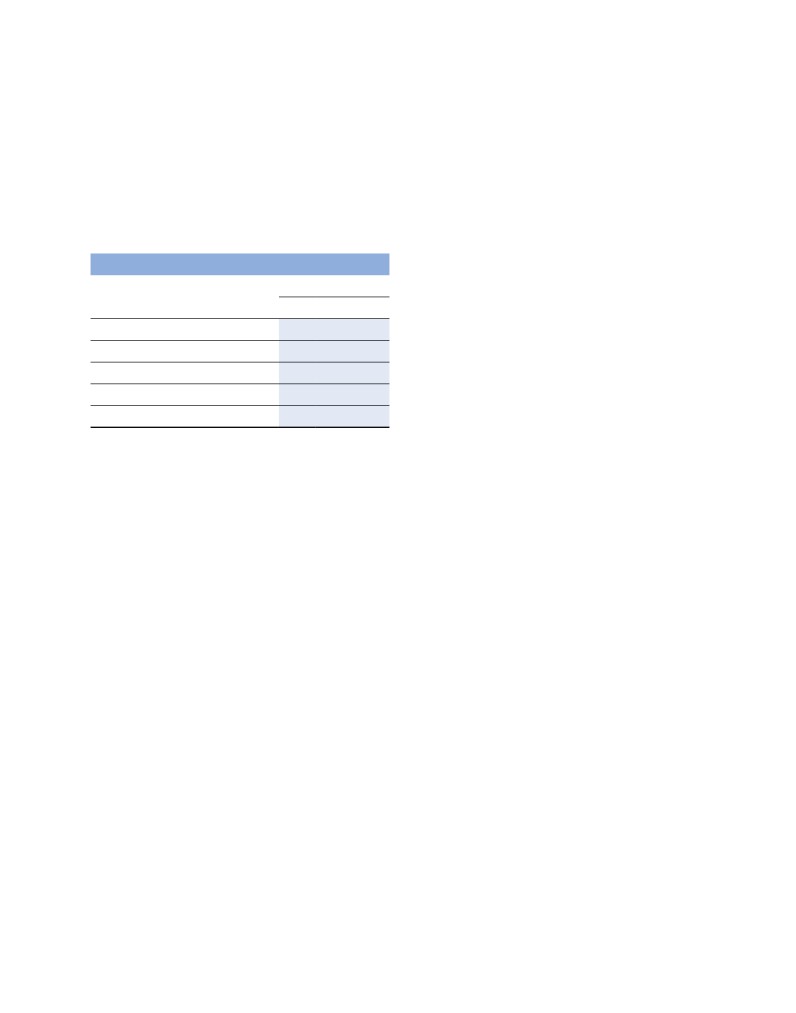
Investment portfolio
e Sviluppo Sostenibile (Energy Efficiency and
December 31, 2014
Sustainable Development - IDeA EESS) and in the
theme fund IDeA Taste of Italy (IDeA ToI);
n.
Euro/Mln.
Equity investments
3
220.5
- a unit in the real estate fund Atlantic Value Added (AVA),
Funds (*)
14
203.0
managed by IDeA FIMIT SGR;
Private Equity Investment
17
423.5
- units in seven venture capital funds.
Alternative asset management (*)
4
201.5
Investment portfolio
21
625.0
(*) Units in private equity funds consolidated on a line-by-line
Alternative asset management
basis and equity investments in subsidiaries relating to
alternate asset management are valued in this table using the
equity method for the Group's portion.
- controlling interest in IDeA Capital Funds SGR
(100%), which manages private equity funds (funds of
funds, co-investment funds and theme funds) with about
EUR 1.5 billion in assets under management and seven
Private equity investment
managed funds;
• Main investments
- controlling interest in IDeA FIMIT SGR (64.30%),
Italy's largest independent real estate asset management
- minority shareholding in Migros, Turkey's leading retail
company, with about EUR 9.0 billion in assets under
chain operator, whose shares are listed on the Istanbul Stock
management and 36 managed funds (including five listed
Exchange. The investment is held through the Luxembourg-
funds);
registered company Kenan Investments S.A., an investment
recorded in the AFS portfolio of the DeA Capital Group (with
- controlling interest in IRE/IRE Advisory (96.99%),
a stake of 17.03%);
which operate in project, property and facility management,
as well as real estate brokerage.
16 DeA Capital - Profile of DeA Capital S.p.A.
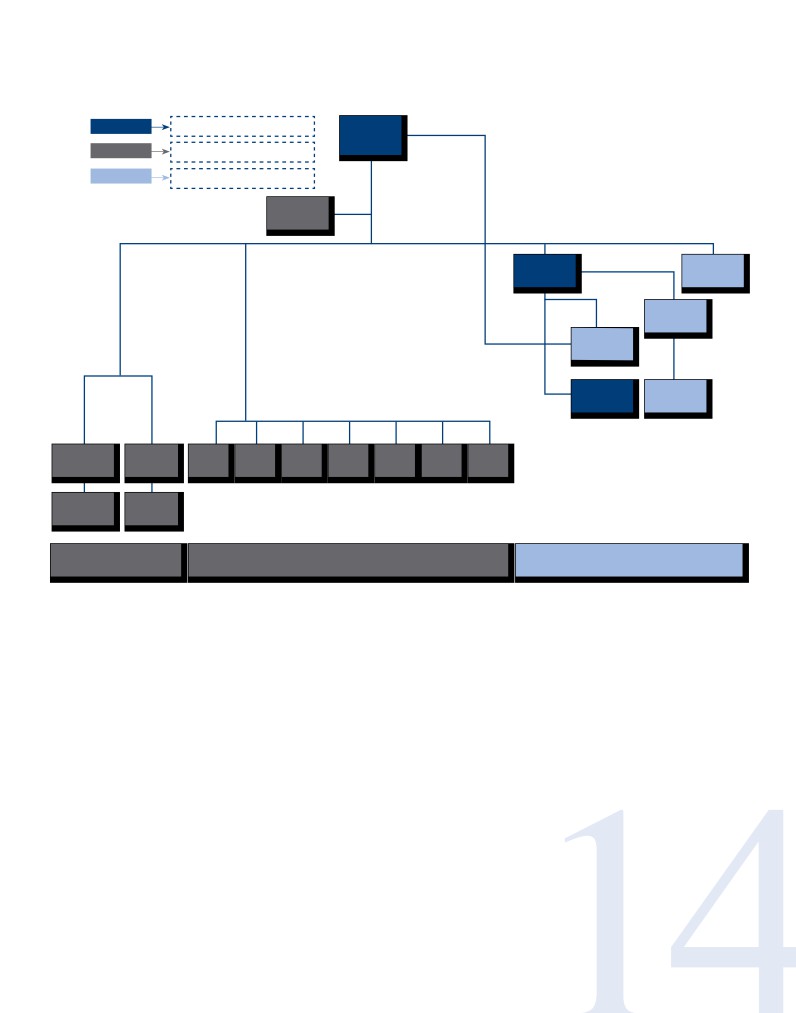
At the end of 2014, the corporate structure of the Group headed by DeA Capital S.p.A. (the DeA Capital Group, or the Group)
was as summarised below:
Holding companies
DeA Capital
S.p.A.
Private Equity Investment
Alternative Asset Management
Shareholdings
and
funds
100%
100%
96.99%
IDeA
DeA Capital
Capital Funds
Real Estate
SGR
1.30%
IRE
3.00%
IDeA FIMIT
SGR
100%
100%
IRE
IDeA RE
Advisory
Shareholding
Shareholding
Quota
Quota
Quota
Quota
Quota
Quota
Quota
Kenan
Sigla
IDeA
ICF II
ICF III
IDeA OF I
EESS
ToI
AVA
Investments
Luxembourg
I FoF
Shareholding
Shareholding
Migros
Sigla
Private Equity
Private Equity Investment
Alternative
Investment “Direct”
“Indirect”
Asset Management
DeA Capital - Annual Financial Statements to 31 December 2014
17
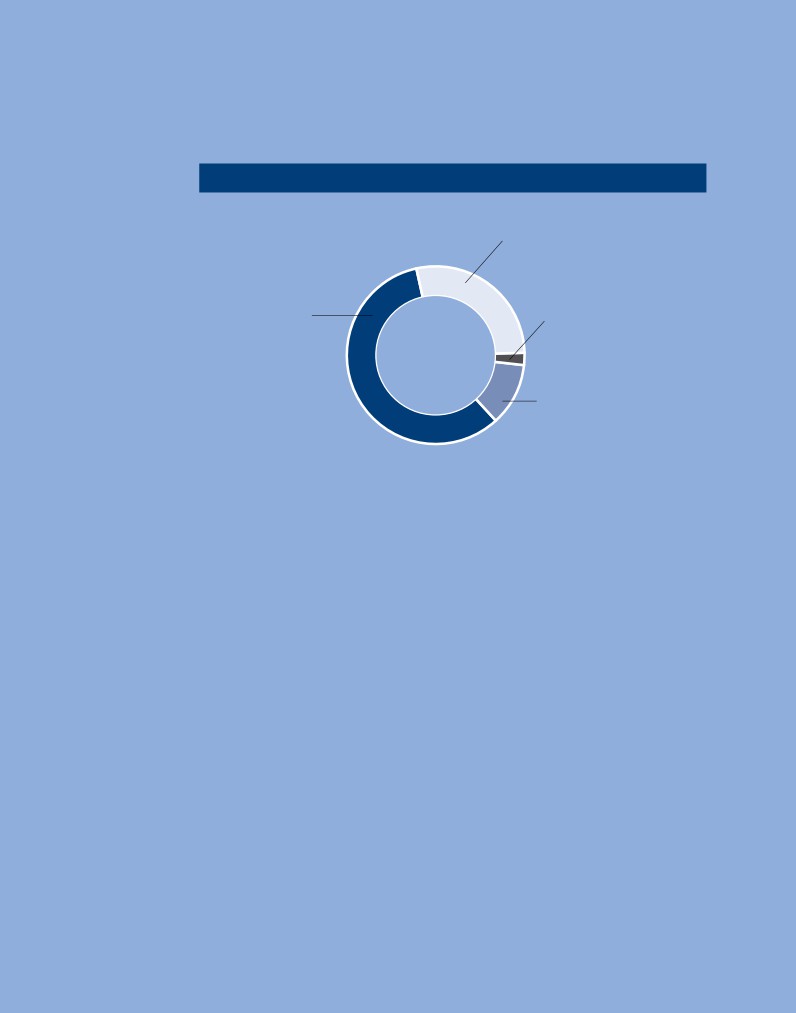
Information for
SHAREHOLDER STRUCTURE - DEA CAPITAL S.P.A. (#)
28.3
%
Free float
58.3
%
2.0
%
De Agostini S.p.A.
Highclere International
Investors LLP
11.4
%
Treasury stock
(#) Figures at 31 December 2014 based on the latest communications available
Note: At 12 March 2015 there were 37,369,276 treasury shares representing 12.2%
of share capital
18 DeA Capital - Information for shareholders
shareholders
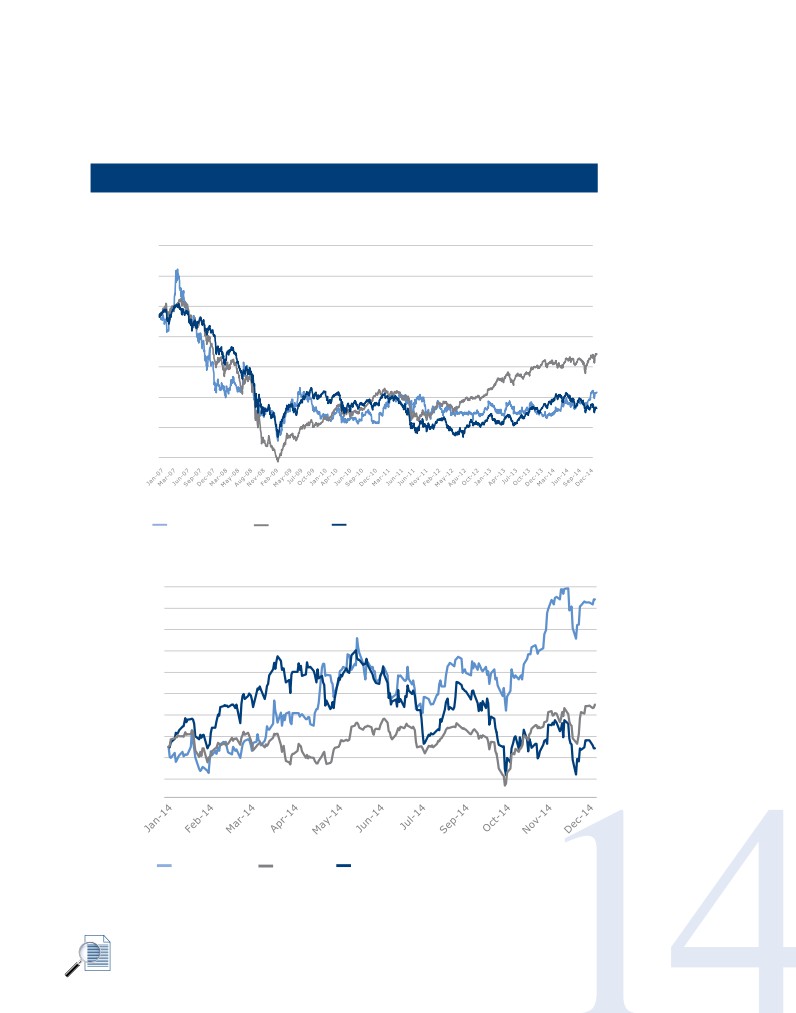
SHARE PERFORMANCE *
Period from 11 January 2007, when DeA Capital S.p.A. began operations, to 31 December 2014.
4,0
3,5
3,0
2,5
2,0
1,5
1,0
0,5
DeA Capital
LPX 50
FTSE All
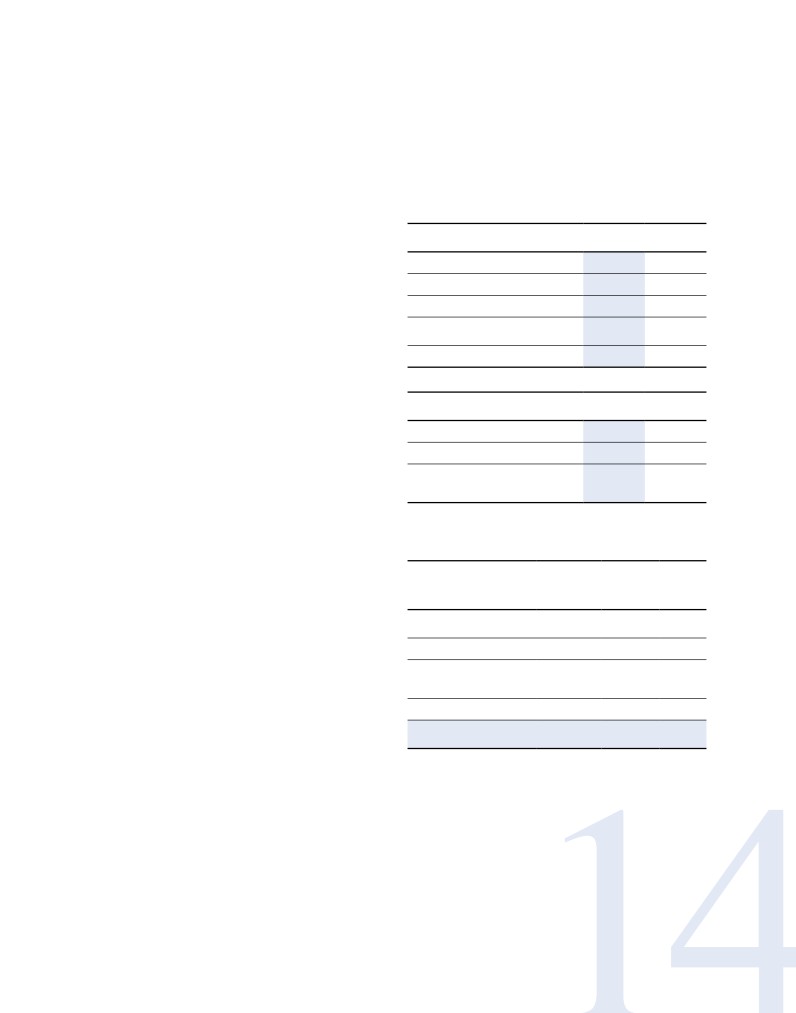
From 1 January 2014 to 31 December 2014.
1,65
1,60
1,55
1,50
1,45
1,40
1,35
1,30
1,25
1,20
1,15
DeA Capital
LPX 50
FTSE All
(*) Source: Bloomberg
For further info:
section: Investor Relations
DeA Capital - Annual Financial Statements to 31 December 2014
19

The performance of the DeA Capital
share
The Company's share price declined by 42.8%
(in Euro)
2014
between 11 January 2007, when DEA Capital
Maximum price
1.65
S.p.A. began operations, and 31 December 2014.
In the same period, the FTSE All-Share® and
Minimum price
1.21
LPX50® fell by 52.4% and 20.9% respectively.
Average price
1.41
Price at 31 December 2014
In 2014, the DeA Capital share rose by 27.6%,
(EUR per share)
1.62
while the Italian market index FTSE All-Share®
shed 0.3% and the LPX50® gained 7.9%. Market
capitalisation rose by over EUR 100 million. The
(EUR million)
31 December 2013
share’s liquidity increased sharply compared
Market capitalisation at
with 2013, with average daily trading volumes of
31 December 2014 (*)
497
around 350,000 shares.
(*) Capitalisation net of treasury shares: EUR 440 million.
The share prices recorded in 2014 are shown
below.
Investor Relations
DeA Capital S.p.A. maintains stable and
The LPX® indices measure the performance of
structured relationships with institutional and
the major listed companies operating in private
individual investors. As in previous years, in 2014
equity (Listed Private Equity or LPE). Due to its
the Company continued with its communication
high degree of diversification by region and type
activities, including attendance at the Star
of investment, the LPX50® index has become
Conference, held in Milan in March, the STAR
one of the most popular benchmarks for the LPE
Conference in London and the Midcap Event in
asset class. The method used to constitute the
Paris, both held in October. The Company met
index is published in the LPX Equity Index Guide.
with over 20 institutional investors at these
For further information please visit the website:
events. During the year the Company has
www.lpx.ch. The DeA Capital share is also listed
also held meetings and conference calls with
on the GLPE Global Listed Private Equity Index,
institutional investors, portfolio managers and
the index created by Red Rocks Capital, a US
financial analysts from Italy and abroad.
asset management company specialising in listed
private equity companies. The index was created
Research coverage of the share is currently carried
to monitor the performance of listed private equity
out by Equita SIM and Intermonte SIM, the two
companies around the world and is composed of
main intermediaries on the Italian market, with
40 to 75 stocks. For further information:
Intermonte SIM acting as a specialist. The research
prepared by these intermediaries is available
in the Investor Relations section of the
In January 2015, the new DeA Capital website
websitewww.deacapital.it. Since the beginning of
was launched with a completely fresh graphic
2015, coverage of the share has also been carried
layout and set of functions. The site can be found
out by Edison Investment Research, an independent
equity research company based in London.
English. The new site has a wealth of information,
financial data, tools, documents, videos and news
In December 2008, the DeA Capital share joined
the LPX50® and LPX Europe® indices.
For further info:
section: Investor Relations
20 DeA Capital - Report on Operations
related to the DeA Capital Group's activities,
3. The DeA Capital Group’s
strategy and investment portfolio. Of particular
key Statement of Financial
note are the following features: i) the site's
Position and Income
responsive design, whereby the graphical layout
automatically adapts to the device on which it is
Statement figures
displayed (computers with various resolutions,
tablets, smart phones, mobile phones, etc.), ii)
The DeA Capital Group’s key Statement of Financial Position
and Income Statement figures to 31 December 2014 are
users can customise the introductory pages of
shown below, compared with the corresponding figures to
the Investor Relations area with repositionable
31 December 2013.
widgets, and iii) users can also directly access
the social networks DeA Capital belongs to
December December
from the homepage, as well as share articles,
(EUR million)
31, 2014
31, 2013
press releases or sections of interest on social
NAV/share (EUR)
2.41
2.30
networks. DeA Capital S.p.A. has strengthened
its presence on Wikipedia and the following social
Group NAV
653.5
629.5
networks, adding its most recent presentations
Investment portfolio
625.0
762.0
to institutional investors: Slideshare and Linkedin
Net financial position - Holding
companies
40.6
(138.7)
spa).
Consolidated net financial position
57.8
(127.4)
During the year, the Company published its
Year
Year
first interactive report, the 2013 Financial
(EUR million)
2014
2013
Statements, which can be found in the “Financial
Parent Company net profit/(loss)
(4.5)
(62.9)
Statements and Reports” section on the website.
Group net profit/(loss)
(57.6)
(31.1)
In addition, DeA Capital S.p.A. won the 2013
Comprehensive income
(Group share)
Oscar di Bilancio financial statements award
(Statement of Performance - IAS 1)
30.1
(94.3)
in the category of “Medium and Small Listed
and Unlisted Banking and Financial Companies”,
receiving special mention for its use of new digital
The table below shows the change in the NAV during 2014.
tools.
Value
No.
per
The website has always been the primary mode
Change in
Total value
shares
share
of contact for investors. They can subscribe to
Group NAV
(EUR m) (millions)
(EUR)
a mailing list and receive all news on the DeA
Group NAV at
31 December 2013
629,5
274,0
2,30
Capital Group in a timely manner, as well as
send questions or requests for information and
Purchase of own shares
(3,7)
(2,4)
1,58*
documents to the Company's Investor Relations
Comprehensive
income - Statement of
area, which is committed to answering queries
Performance - IAS 1
30,1
promptly, as stated in the Investor Relations
Other changes in NAV
(2,4)
Policy published on the site. A quarterly
Group NAV at
newsletter is also published for investors to keep
31 December 2014
653,5
271,6
2,41
them updated on the main items of news on the
(*) Average price of purchases in 2014.
Group, and analyse the Group’s quarterly results
and share performance.
DeA Capital S.p.A. is therefore continuing with
its intention to strengthen its presence on the
web and to make information for stakeholders
available through many channels.
DeA Capital - Annual Financial Statements to 31 December 2014
21
The table below provides details of the Group’s Statement of Financial Position at 31 December 2014.
31 December 2014
31 December 2013
EUR m
% NIC EUR/Sh.
EUR m
% NIC EUR/Sh.
Private Equity Investment
- Santé / GDS
0.0
0%
0.00
221.2
29%
0.81
- Kenan Inv. / Migros
209.1
34%
0.77
132.4
17%
0.48
- Funds - Private Equity / Real Estate
203.0
33%
0.75
191.3
25%
0.70
- Other (Sigla,...)
11.4
2%
0.04
13.6
2%
0.05
Total IEP (A)
423.5
69%
1.56
558.5
73%
2.04
Alternative Asset Management
- IDeA FIMIT SGR
144.6
24%
0.53
145.5
19%
0.53
- IDeA Capital Funds SGR
49.9
8%
0.18
51.8
7%
0.19
- IRE / IRE Advisory
7.0
1%
0.03
6.2
1%
0.02
Total AAM (B)
201.5
33%
0.74
203.5
26%
0.74
Investment portfolio (A+B)
625.0
102%
2.30
762.0
99%
2.78
Net other assets (liabilities)
(12.1)
-2%
(0.04)
6.2
1%
0.03
NET INVESTED CAPITAL
612.9
100%
2.26
768.2
100%
2.81
Net financial position - Holding companies
40.6
7%
0.15
(138.7)
-18%
(0.51)
NAV (*)
653.5
107%
2.41
629.5
82%
2.30
(*) Consolidated shareholders' equity.
4. Significant events during
First closing of the ICF III fund
of funds
the year
On 10 April 2014, the first closing of the ICF III fund was
The significant events that occurred in 2014 are reported
completed, a closed-end real estate mutual fund under Italian
below.
law for qualified investors. Managed by IDeA Capital Funds
SGR, it is dedicated to investment in private equity funds
managed by operators with a proven track record of returns
Private equity funds - paid calls/
and solidity, and focuses on three segments: i) Core (mainly
distributions
buyouts) ii) Credit & distressed and iii) Emerging markets,
both directly and jointly with other funds.
In 2014, the DeA Capital Group increased its investment in the
following funds by a total of EUR 18.6 million: IDeA I FoF (EUR
DeA Capital S.p.A. took part in this closing via the subscription
3.5 million), ICF II (EUR 7.3 million), ICF III (EUR 1.8 million),
of 250 units, representing a maximum commitment of up to
IDeA OF I (EUR 2.8 million), IDeA EESS (EUR 2.3 million),
EUR 12.5 million (21.9% of the total commitment reached by
IDeA ToI (EUR 0.1 million) and AVA (EUR 0.8 million).
the fund, equal to around EUR 57 million).
At the same time, the DeA Capital Group received capital
reimbursements totalling EUR 29.6 million from the IDeA I FoF
Share Buyback Plan
(EUR 21.4 million), ICF II (EUR 2.9 million), IDeA OF I (EUR
5.1 million) and other venture capital funds (EUR 0.2 million),
On 17 April 2014, the shareholders’ meeting of DeA Capital
to be used in full to reduce the carrying value of the units.
S.p.A. authorised the Board of Directors to buy and sell,
on one or more occasions, on a rotating basis, a maximum
Thus, overall, the private equity funds in which DeA Capital
number of ordinary shares in the Company representing a
S.p.A. has invested have produced a net positive cash balance
stake of up to 20% of the share capital.
of approximately EUR 11.0 million for the portion relating to
the Group.
The new plan replaces the previous plan approved by
the shareholders’ meeting on 19 April 2013 (which was
22 DeA Capital - Report on Operations

scheduled to expire with the approval of the 2013 Annual
employees of the Company, its subsidiaries and of the Parent
Financial Statements), and will pursue the same objectives
Company De Agostini S.p.A. who carry out important roles for
as the previous plan, including purchasing treasury shares to
the Company.
be used for extraordinary transactions and share incentive
schemes, offering shareholders a means of monetising their
In line with the criteria specified in the regulations governing
investment, stabilising the share price and regulating trading
the DeA Capital S.p.A. Stock Option Plan 2014-2016, the
within the limits of current legislation.
Board of Directors also set the exercise price for the options
allocated at EUR 1.32, which is the arithmetic mean of the
The authorisation specifies that purchases may be carried
official price of ordinary DeA Capital shares on the Mercato
out up to the date of the shareholders’ meeting to approve
Telematico Azionario, the Italian screen-based trading system
the Financial Statements for the Year Ending 31 December
organised and managed by Borsa Italiana S.p.A., on the
2014, and in any case, not beyond the maximum duration
trading days between 17 March 2014 and 16 April 2014.
allowed by law, in accordance with all the procedures allowed
by current regulations, and that DeA Capital S.p.A. may also
The shareholders’ meeting of 17 April 2014 also approved a
sell the shares purchased for the purposes of trading, without
paid capital increase, in divisible form, without option rights,
time limits. The unit price for the purchase of the shares
via the issue of a maximum of 2,000,000 ordinary shares to
is set on a case-by-case basis by the Company's Board of
service the DeA Capital S.p.A. Stock Option Plan 2014-2016.
Directors, but in any case must not be more than 20% above
or below the share’s reference price on the trading day prior
The shareholders’ meeting also approved the adoption of
to each individual purchase. In contrast, the authorisation to
the Performance Share Plan 2014-2016, which provides for
sell treasury shares already held in the Company’s portfolio,
the allocation of a maximum of 500,000 units. On the same
and any shares bought in the future, was granted for an
date, to implement the shareholders’ resolution, the Board
unlimited period, to be implemented using the methods
of Directors of DeA Capital S.p.A. voted (i) to launch the
considered most appropriate and at a price to be determined
DeA Capital Performance Share Plan 2014-2016 approved
on a case-by-case basis by the Board of Directors, which
by the shareholders’ meeting, vesting the Chairman of the
must not, however, be more than 20% below the share's
Board of Directors and the Chief Executive Officer with all
reference price on the trading day prior to each individual
the necessary powers, to be exercised severally and with full
sale (apart from in certain exceptional cases specified in the
power of delegation; and (ii) to allocate a total of 393,500
plan). Sale transactions may also be carried out for trading
units (representing the right to receive ordinary shares in
purposes.
the Company free of charge, under the terms and conditions
of the plan) to certain employees of the Company, its
On the same date, the Board of Directors voted to launch
subsidiaries and of the Parent Company De Agostini S.p.A.
the plan to buy and sell treasury shares authorised by the
who carry out important roles for the Company.
shareholders’ meeting, vesting the Chairman of the Board of
Directors and the Chief Executive Officer with all the necessary
The shares allocated due to the vesting of units will be drawn
powers, to be exercised severally and with full powers of
from the treasury shares already held by the Company so that
delegation.
the allocation will not have a dilutive effect.
On 6 November 2014, the Board of Directors, voted to adhere
The shareholders’ meeting also approved the Company’s
to the markets practice intended for the purchase of own
Remuneration Policy pursuant to art. 123-ter of the
shares to be used to create the securities “stock”, pursuant
Consolidated Finance Law.
Consob resolution 16839 of 19 march 2009.
Appointment of the new Board of
Stock option and performance
Directors of IDeA FIMIT SGR
share plans
On 18 April 2014, the shareholders meeting of IDeA FIMIT
On 17 April 2014, the shareholders’ meeting of DeA Capital
SGR appointed the Company's new Board of Directors, which
S.p.A. approved the DeA Capital Stock Option Plan 2014-2016.
will remain in office until the shareholders' meeting called to
To implement the resolution of the shareholders’ meeting,
approve the Financial Statements for 2016. The number of
the Board of Directors voted (i) to launch the DeA Capital
Directors was reduced from 13 to eight.
Stock Option Plan 2014-2016 approved by the shareholders’
Subsequently, at the first meeting of the new Board of
meeting, vesting the Chairman of the Board of Directors and
Directors of the same company on 28 April 2014, Gualtiero
the Chief Executive Officer with all necessary powers, to be
Tamburini (designated by shareholder INPS) was appointed
exercised jointly or severally and with full power of delegation;
as Chairman and Emanuele Caniggia (designated by the DeA
and (ii) to allocate a total of 1,550,000 options to certain
Capital Group) as CEO.
DeA Capital - Annual Financial Statements to 31 December 2014
23

Acquisition of a shareholding in
On 1 October 2014, following approval by the competent
Innovation Real Estate
authorities, Santé and SDE sold their stake in GDS to the
Buyers at a price of EUR 16.00 per share after cashing in the
Following the appointment of Emanuele Caniggia as the new
dividend of EUR 0.75 due to them.
CEO of IDeA FIMIT SGR and his concurrent resignation as CEO
of Innovation Real Estate, DeA Capital Real Estate purchased
Santé and SDE received a total of approximately EUR 788
the shares held by Emanuele Caniggia in Innovation Real
million, including the dividend, which will be used partly to
Estate for about EUR 2.2 million, including the special shares
repay the two companies' financial debt (around EUR 407
(with limited economic rights), equal to 13.3% of the capital.
million, of which EUR 31.4 million to the DeA Capital Group to
As a result of this transaction, DeA Capital Real Estate holds a
repay the existing quasi-equity loan) and partly to distribute
stake of 96.99% in Innovation Real Estate.
cash to shareholders (some EUR 381 million).
The net proceeds for the DeA Capital Group from the
Sale of the shareholding in
transaction amounted to EUR 164.1 million (EUR 195.5 million
Soprarno SGR
taking into account the repayment of the loan granted to
Santé).
On 9 May 2014, the sale of the shareholding in Soprarno SGR
was completed for a total price of around EUR 1.3 million, in
line with the carrying value at 31 December 2013.
Changes in available loan facilities
On 25 June 2014, DeA Capital S.p.A. signed an agreement
Dividends from Alternative Asset
with Intesa Sanpaolo for a loan of up to EUR 40 million, to
Management
replace an uncommitted credit line of the same amount with
the same bank.
On 22 April 2014, IDeA Capital Funds SGR paid dividends
totalling EUR 4.0 million relating entirely to DeA Capital S.p.A.
The agreement provides an unsecured revolving credit
(EUR 4.4 million in 2013).
facility, available from 30 June 2014 for a three year term,
with interest based on three- or six-month Euribor plus a
On 8 May 2014, IDeA FIMIT SGR paid dividends totalling EUR
margin.
9.0 million, of which around EUR 5.8 million related to the DeA
Capital Group (EUR 10.0 million in 2013).
With regard to the loan facilities in place with Mediobanca -
Banca di Credito Finanziario S.p.A., in October and November
On 27 June 2014, IRE paid dividends totalling EUR 2.9
2014 DeA Capital S.p.A. made a final repayment of the bullet
million, of which EUR 2.7 million related to the DeA Capital
loan facility (EUR 80 million) and a concurrent repayment of
Group (EUR 2.3 million in 2013).
the revolving facility, reducing its balance to zero and at the
same time restoring its availability up to the maximum of EUR
In summary, dividends paid during 2014 by the Alternative
40 million.
Asset Management business to the DeA Capital Group’s
holding companies totalled EUR 12.5 million (EUR 16.7 million
On 19 November 2014, DeA Capital S.p.A. signed a
in 2013).
one-year extension to the term of the above-mentioned
Mediobanca revolving facility until 16 December 2016.
Sale of interest in GDS
At 31 December 2014, these existing revolving facilities with
Intesa Sanpaolo and Mediobanca were fully available (total of
On 10 June 2014, Santé, in which the DeA Capital Group
EUR 80 million).
holds a 43% stake, and its wholly-owned subsidiary Santé
Dévéloppement Europe (SDE) signed an agreement to sell
their 83.43% stake in Générale de Santé (GDS) to Ramsay
Health Care and Crédit Agricole Assurances (Buyers), at a
price of EUR 16.75 per share cum dividend.
24 DeA Capital - Report on Operations

Revolving loan to Sigla
DeA Capital S.p.A. has undertaken to continually work on the
transparency and quality of its financial reporting, and has set
On 26 September 2014, with a view to making the best use
itself the goal of making constant refinements.
of cash, the DeA Capital Group signed a 12-month revolving
loan agreement for up to EUR 5 million, in favour of Sigla, a
wholly-owned subsidiary of the subsidiary Sigla Luxembourg.
First closing of “Taste of Italy”
This loan is secured by a lien on 51% of the shares of the
private equity fund
borrowing company.
On 30 December 2014, the first closing of the IDeA Taste of
Italy fund (ToI) was completed. This is a closed-end mutual
Restructuring of
fund under Italian law managed by IDeA Capital Funds SGR
the DeA Capital Group
for qualified investors. Focusing on the agricultural foods
sector, its objective is to invest along the entire chain of the
On 14 November 2014, DeA Capital S.p.A. completed the
sector, from raw materials to processing, distribution and
merger by incorporation of the wholly-owned Luxembourg
catering.
subsidiary DeA Capital Investments.
DeA Capital S.p.A. took part in this closing via the subscription
At the same time, DeA Capital Real Estate completed
of 172 units, representing a maximum commitment of up to
the merger by incorporation of the wholly-owned Italian
EUR 8.6 million (10.0% of the total commitment reached by
subsidiary, I.F.IM.
the fund, equal to around EUR 86.4 million).
These transactions had no impact on the Group's Consolidated
Financial Statements and are expected to make it possible to
Agreement for the sale of a stake
optimise the organisational structure.
in Migros Ticaret
On 31 December 2014, Moonlight Capital S.A., a wholly-
2014 Oscar di Bilancio (Financial
owned special purpose vehicle of Kenan Investments S.A.
Statements Oscar) award
(in which DeA Capital S.p.A. holds a stake of about 17%)
and the direct and indirect owner of an 80.5% stake in
On 1 December 2014, DeA Capital S.p.A. won the 2014
Migros, signed an agreement with Anadolu Endüstri Holding
Oscar di Bilancio financial statements award, the prestigious
(Anadolu), a leading Turkish conglomerate, for the sale of
recognition promoted by Ferpi (the Italian Public Relations
40.25% of Migros to the latter.
Federation) and awarded each year to companies that
distinguish themselves for the transparency and quality of
This agreement also called for the exchange of put and call
their corporate reporting.
options between the parties, which can be exercised between
24 months and 30 months after the first sale, for a further
The Financial Statements Oscar jury decided to give the prize
9.75% stake in Migros.
to the 2013 Financial Statements of DeA Capital S.p.A. in the
Medium and Small Listed and Unlisted Banking and Financial
The sale of the first 40.25% and any future sale of the
Companies category for the following reasons: “The Financial
subsequent 9.75% of Migros are projected using a base
Statements of DeA Capital S.p.A. demonstrate careful
valuation for Migros of TRY 26 per share.
attention from the standpoint of content, and the operating
and financial information stands out for its high quality and
For the portion relating to DeA Capital S.p.A., at the TRY/
clear writing style. The Company's results and performance
EUR exchange rate on 31 December 2014, the sale of the first
are covered accurately with a writing style that makes them
40.25% equates to approximately EUR 110 million, while any
easy to read. Lastly, another area worth mentioning is the
future sale of the subsequent 9.75% equates to approximately
use of new digital tools: DeA Capital S.p.A. has also made
EUR 26 million.
its documentation available on the web and enhanced it with
videos and images that make accessing the main financial
statement items straightforward and enjoyable; as such, the
Company is on a par with the best practices in the industry.
DeA Capital S.p.A. has also made its financial statements
available in English.”
DeA Capital - Annual Financial Statements to 31 December 2014
25
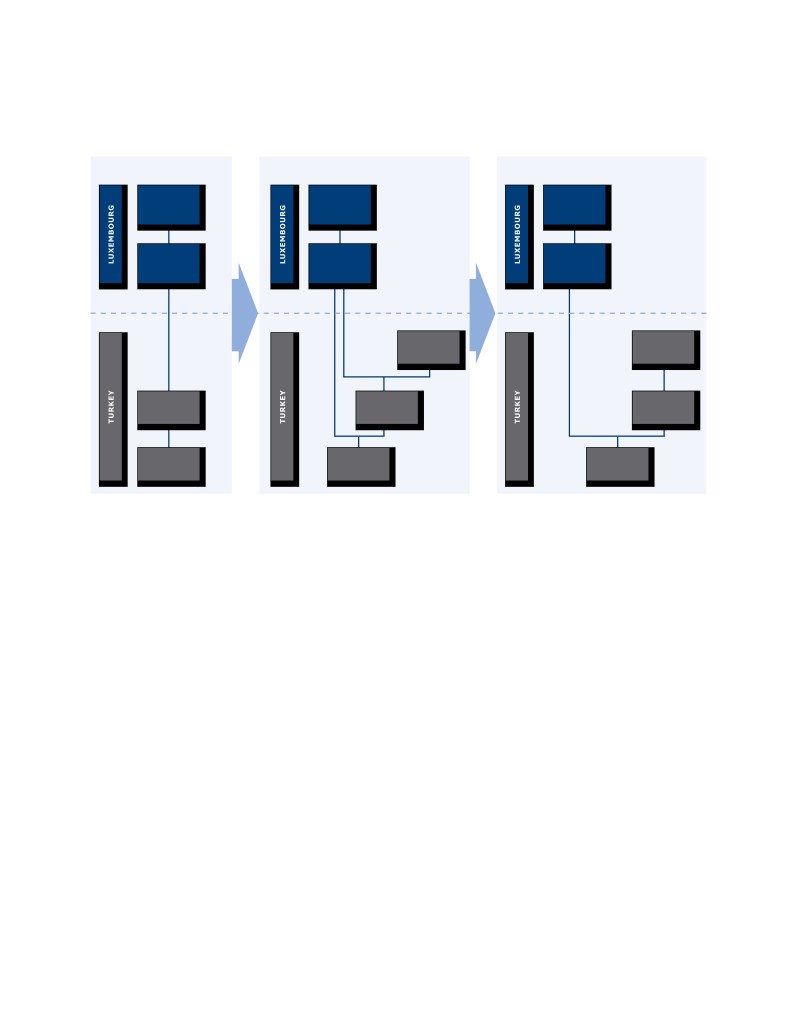
The
execution of the share transfer is subject to the necessary approvals
of the relevant authorities (scheduled by the end of the
first half of 2015).
The simplified structure of the transaction is shown in the diagram below.
Agreement with Anadolu: simplified structure of the transaction
Situation pre-signing
Situation post-dismission (1H 2015E)
Situation post-call-put (1H 2017E)
KENAN
KENAN
KENAN
100%
100%
100%
MOONLIGHT
MOONLIGHT
MOONLIGHT
19.5%
Anadolu
Anadolu
100%
30.5%
80.5%
30.5%
100%
MH
MH
MH
80.5%
50%
50%
Migros
Migros
Migros
5. The results of the
Access to cheap credit fuelled the debt market, making
it possible to refinance the capital structure and make
DeA Capital Group
distributions to investors. This environment fostered significant
The consolidated results relate to the operations of the DeA
investment activity in the private equity market in terms of
Capital Group in the following businesses:
both volume and transaction value.
• Private Equity Investment, which includes the reporting units
The middle-market segment (transactions between USD 25
involved in private equity investment, broken down into
million and USD 1 billion) was the most active for fundraising
shareholdings (direct investments) and investments in funds
and transactions recorded, with greater opportunities available
(indirect investments);
and the largest transactions offering higher expected returns.
• Alternative Asset Management, which includes reporting
In 2014, transactions worth an estimated USD 50 billion were
units involved in asset management activities and related
concluded on the secondary market, a 40% increase in volume
services, with a focus on the management of private equity
over 2013. This activity was driven by an excellent year of
and real estate funds.
fundraising for secondary market funds and from investors
“forced” to put capital to work due to the huge amount of cash
not yet invested in their programmes.
Private equity
For investors in private equity (limited partnerships/LPs),
2014 was a record year in terms of both distribution flows and
investments made. And fundraising and asset class allocation
were similar to pre-crisis levels.
26 DeA Capital - Report on Operations
Investment prospects and the outlook
Investment increased compared with 2013 (+10%). At USD
for the European and global private equity
332 billion, the total value of transactions in 2014 was the
markets
highest since 2007.
From a regional point of view, investment growth was due to
2014 saw heated competition to access the programmes
greater activity posted by Europe (+16%), but especially by
of the best managers (general partners/GPs) in the
Asia/rest of the world (+54%), where the growth potential of
industry, who tend to raise their funds in just a few months,
emerging countries has started again to attract new capital.
sometimes leaving a single closing available to investors.
By contrast, activity in the US has remained virtually on a par
Long-term relationships, above all with GPs not in the
with the high values seen in 2013.
portfolio, are essential if investors are to access the best
investment opportunities in the future.
As shown in the chart above, global M&A transaction volumes
are back to the peak seen in 2006. In this context, it should
Despite a few exceptions, relations between fund managers
be stressed that the private equity industry contributed
and investors have continued to move in favour of LPs
27% of the volume of M&A transactions completed in 2014;
in terms of lower fees charged for fund management
this percentage is even higher than pre-crisis levels, and
and performance. In addition, investors have expressed
confirms the growing importance of the industry in the global
a growing interest in participating in co-investment
economy.
opportunities.
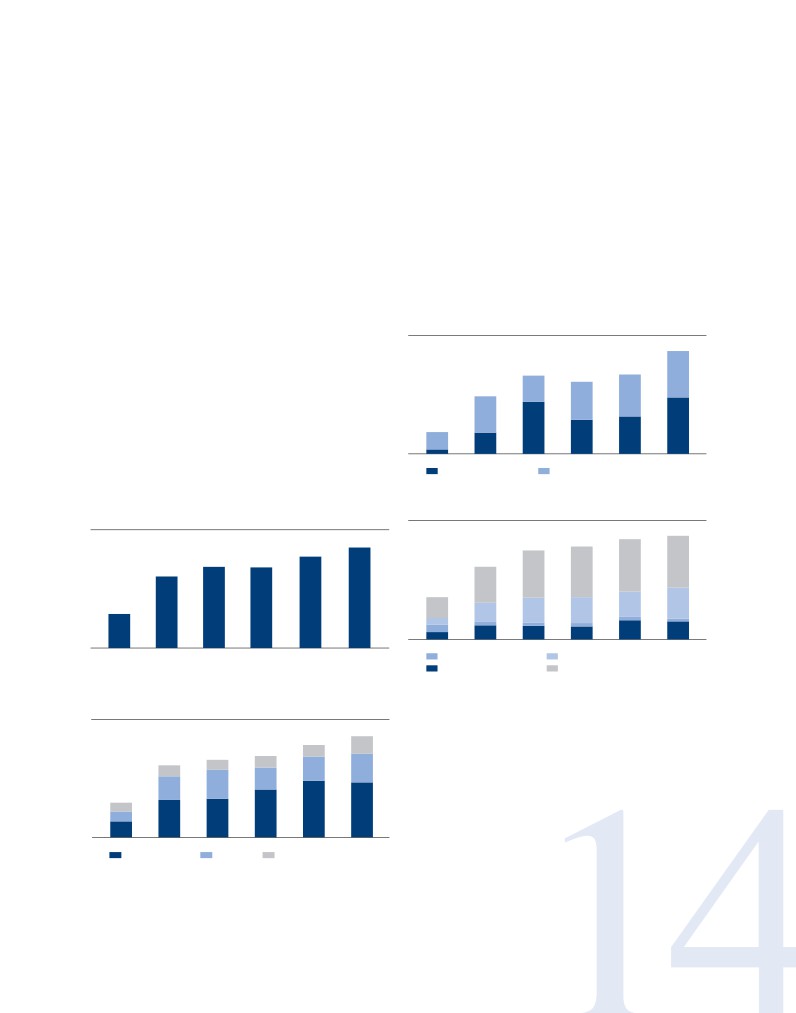
Volume of divestments by buy-out funds (USD billion)
428
In the last few months of 2014, a new climate of uncertainty
started to develop after the sharp drop in oil prices. Current
326
330
301
45%
prices could reduce investment activity in the energy sector
240
33%
53%
and delay the sale of shareholdings to investors.
53%
63%
91
55%
In addition, the potential interest rate hike in the US, which
67%
47%
47%
is projected for mid-2015, could reduce investments in the
80%
37%
20%
US economy. However, we project that at least in the first
2009
2010
2011
2012
2013
2014
2nd Half
1st Half
half of the year, investment and sale activity in the private
equity industry will remain about the same as in 2014.
Source: Preqin
Number of divestments by buy-out funds
Global value of investments in buy-outs (USD billion)
1,550
1,604
332
1,435
1,376
302
267
266
1,126
50%
52%
236
55%
53%
50%
655
113
25%
30%
50%
28%
28%
26%
16%
3%
3%
5%
4%
4%
17%
19%
17%
17%
19%
15%
14%
2009
2010
2011
2012
2013
2014
2009
2010
2011
2012
2013
2014
Restructuring
Sale to GP
IPO
Trade Sale
Source: Preqin
Source: Preqin
Global value of investments in buy-outs
(USD billion)
The positive performance of the financial markets in 2014
332
303
generated record divestments by buy-out funds; totalling USD
17%
267
12%
255
428 billion, this was 30% higher than in 2013.
236
13%
14%
15%
27%
28%
27%
37%
The main method of divestment in 2014 was the secondary
33%
113
buy-out, which was up by 22%.
26%
61%
55%
59%
27%
52%
50%
47%
Strong valuations of stock market indices, especially in the
2009
2010
2011
2012
2013
2014
US, fostered disposals through IPOs, which represented
North America
Europe
Asia and rest
17% of exits by number. However, the slowdown in stock
of the world
Source: Preqin
market indices in the last quarter of 2014 caused a delay in
DeA Capital - Annual Financial Statements to 31 December 2014
27
the listing processes of several companies. If stock markets
It is projected that 2015 could also be a favourable year
remain stable or rise, many transactions that have already
for distributions, but probably not to the same extent as in
launched could be completed during the current year.
recent years, especially if oil prices remain at their current
level and thus prolong divestments from certain companies
related to the sector.
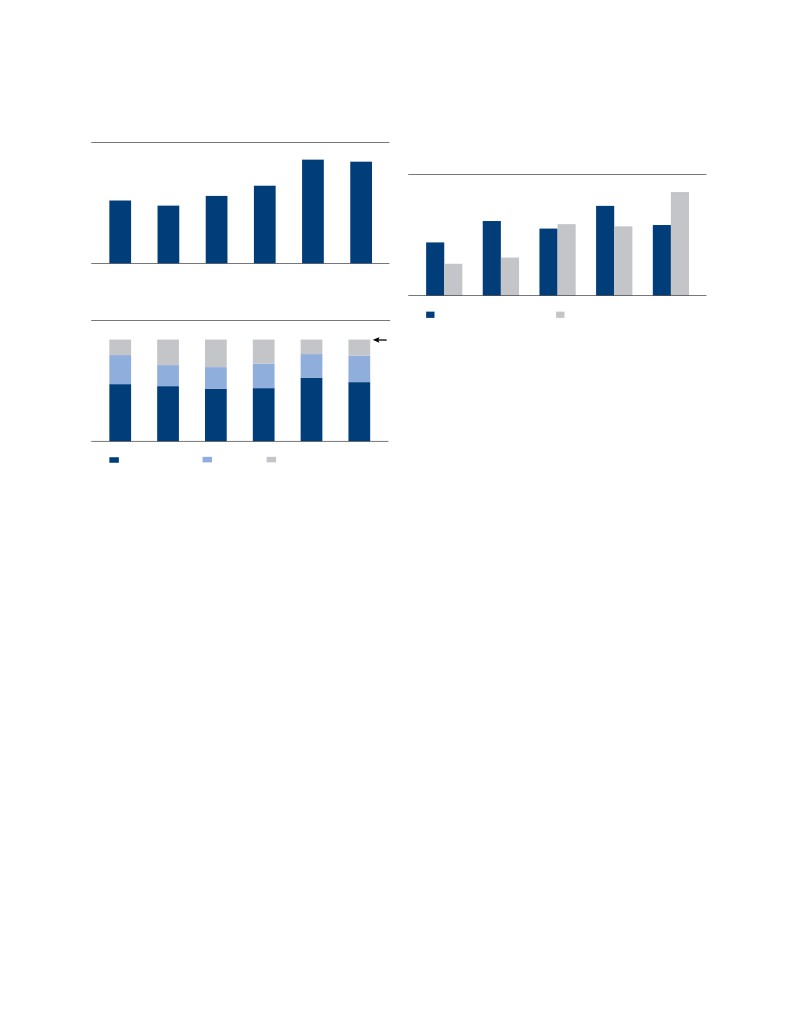
Total PE fundraising (USD billion)
527
517
Global capital calls and distributions of PE funds (USD billion)
394
568
342
319
295
492
409
392
381
388
366
292
209
174
2009
2010
2011
2012
2013
2014
Source: Preqin
2009
2010
2011
2012
2013
Total PE fundraising by region (USD billion)
Capital calls (US$ Mld)
Distributions (US$ Mld)
Source: Preqin
319
295
342
394
527
517
15%
14%
16%
25%
27%
24%
100%
28%
23%
26%
Lastly, the investment themes suggested by the current
21%
22%
24%
market situation are as follows:
56%
54%
62%
58%
52%
52%
• In Europe, fundraising shot up to levels similar to those in
2006. This rise was mainly due to an increase in operators
specialising in credit strategies, who lend to companies in
2009
2010
2011
2012
2013
2014
North America
Europe
Rest of the world
place of credit institutions, and in operators in distressed
Source: Preqin
debt, who exploit deleveraging by banks to purchase
companies' securities at a discount, thereby generating
With over USD 500 billion in capital raised (a level very
attractive returns through coupon payments and with a low
similar to 2013), 2014 was another positive year for
risk profile.
fundraising. 2014 also saw a reduction in the number of
funds collected, which translated into an increase in average
• In the US, most transactions have involved medium and
fund size, especially in emerging countries.
large-sized companies. In 2014, the creation of value
through operational improvements was one of the main
The increase in fundraising was mainly due to the large
mechanisms to provide LPs with adequate returns, despite
number of distributions received in 2013, which generated
higher entry prices than in the past. This trend should also
more cash in the system and less exposure to the asset
continue in 2015, benefiting managers with significant
class, thereby shifting allocation towards private equity. In
operational expertise.
regional terms, compared to 2013, fundraising declined in
North America, but increased in both Europe (+11%) and
• With regard to emerging markets, higher valuations on
emerging markets (+6%). The increase in global fundraising
a number of emerging stock markets in 2014, such as in
has driven up the level of dry powder (committed capital
China and India, drove up transaction prices. Nonetheless,
waiting to be invested); this helps increase competition and
LPs will continue to invest in these economies in 2015
maintain prices at fairly high levels, but could put pressure
to benefit from growth trends in domestic consumption.
on GPs to invest capital more quickly.
Economic reforms will favour growth, especially for smaller
companies in Latin American countries such as Mexico,
Peru, Chile and Colombia.
As the chart below shows, distributions greatly exceeded
capital calls at a global level in 2013. Data on sales and
• The decrease in oil prices has hit equities and bonds in
returns in public markets suggest that the same trend
the energy sector hard. About 20% of the US high yield
repeated itself in 2014.
market consists of bonds of energy companies. The general
28 DeA Capital - Report on Operations

Non-residential sales in the UK, Germany, Ireland,
reduction in energy bond prices is creating a market
Spain and Italy in the third quarter (EUR billion)
opportunity that many managers would like to seize by
24%
+30%
240%
174%
40%
investing in the debt of companies with positive cash flow
and strong assets. Excellent investment opportunities could
8.5
1.6
18.4
3.5
1.2
arise in the energy debt market in the coming months, and
14.8
6.5
0.9
many GPs have already entered the market with dedicated
programmes.
1.3
0.5
Q313
Q314
Q313
Q314
Q313
Q314
Q313
Q314
Q313
Q314
Private equity in Italy
United
Germany
Ireland
Spain
Italy
Kingdom
Statistics compiled by AIFI (the Italian Private Equity and
Source: CBRE
Venture Capital Association) and currently updated for the
first half of 2014 show an increase in fundraising compared
to the same period in 2013. Capital raised in the market by
independent operators totalled EUR 434 million, a significant
Real Estate in Italy
year-on-year rise (+168%) on the first half of 2013.
In the third quarter of 2014, institutional investments in real
There were 139 new investments worth a total of EUR
estate in Italy exceeded EUR 1 billion, a 5.5% increase on
1,890 million (up by 34% compared with the same period in
the previous quarter2. Investment volumes rose for the third
2013). In value terms, the bulk of the resources invested,
consecutive quarter, with investor interest still high after
in line with previous years, went into buy-out transactions,
the summer. Investment volumes were above the quarterly
which attracted EUR 1,153 million, an increase of 25% on the
average of the last three years, while portfolio transactions
same half of the previous year.
remained the main component of total investments, at just
over one-half. In addition to the available liquidity, real
Divestment activity remained virtually unchanged in the
estate investments in Italy are attracting growing numbers
first half of 2014: 68 investments were sold, representing
of investors who are looking to Europe and gradually shifting
a 5% increase on the same period in 2013. The amount
their focus to non-core markets offering better investment
divested, calculated at historical acquisition cost, totalled EUR
opportunities.
886 million, compared to EUR 1,106 million in the first half of
2013 (-20%).
In recent months, a number of new developments have
been introduced in the Italian government's “Sblocca Italia”
(Unlock Italy) initiative to kick-start the economy, which
Real Estate
could boost growth in investment volumes in the Italian
real estate sector. These comprise provisions to simplify the
Real Estate in Europe
rules for setting up listed real-estate investment companies
(SIIQs) and to make lease agreements between owners and
Direct investment in non-residential European real
occupants more balanced (where the annual rent is more
estate in the first quarter of 2014 was approximately EUR
than EUR 150 thousand). Finally, the “Competition Decree”
48 billion, up 4% quarter-on-quarter and 27% year-on-year.
expands the supply of lenders to entities other than banks.
Investments in the first nine months of 2014 totalled around
In particular, this would allow insurance companies to offer
EUR 130 billion, up 27% year-on-year. Although the core
financing without having to use a bank as an intermediary.
European countries, such as the UK and Germany, continued
Providing greater availability of credit could be an important
to perform well, the best percentage growth in investment
driver for future real estate investments.
in the third quarter of 2014 was recorded by the peripheral
countries, especially Ireland and Spain (respectively +240%
In the first nine months of 2014, investment volumes
and +174% year-on-year)1, albeit from a fairly low base.
totalled approximately EUR 2.7 billion, a 7% fall year-
on-year. This result was partly due to the slow process of
completing investments, together with a supply shortfall that
reduced opportunities to acquire large-scale assets.
1. CBRE, European Investment Quarterly, Q3 2014
2. CBRE, Italian Investment Quarterly, Q3 2014
DeA Capital - Annual Financial Statements to 31 December 2014
29
Foreign investment in the first nine months accounted for
As usual, Milan and Rome represented the benchmark
71% of the total, with international investors still looking with
markets for the sector. In the third quarter, the value
increasing interest to the better yields offered by peripheral
of investments in the business sector in Milan was
countries, the result of repricing in recent years.
approximately EUR 340 million, more than double the
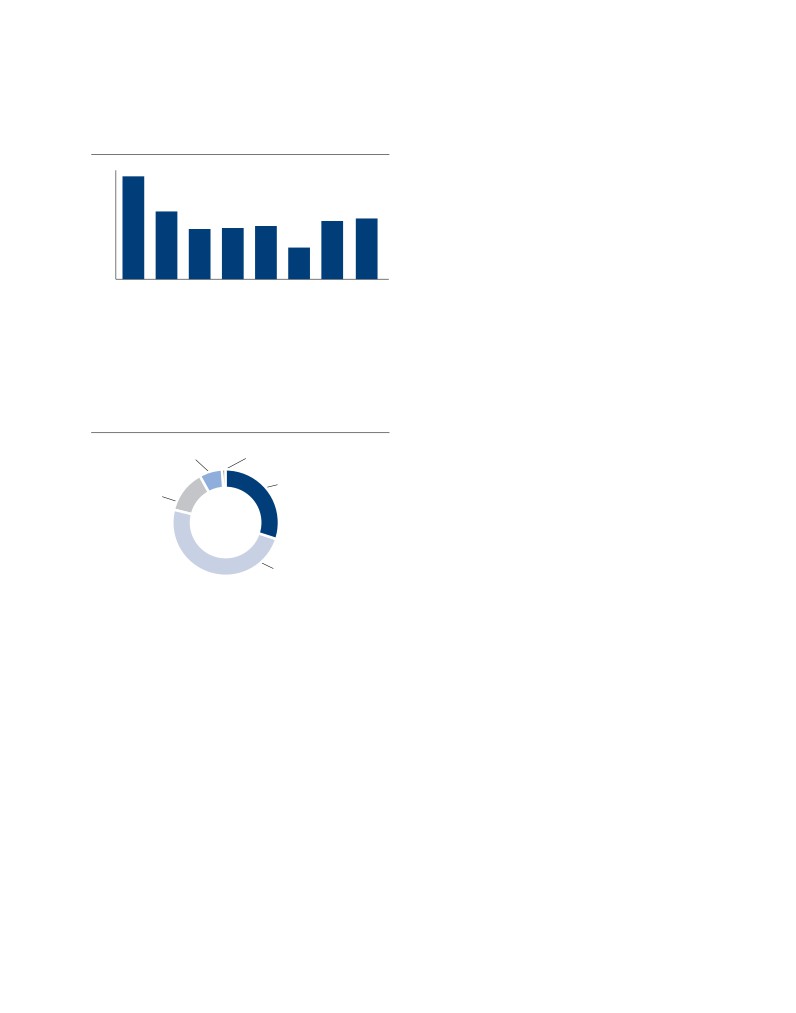
previous quarter. The volume invested year-to-date was just
Sales and purchases by institutional investors
over EUR 660 million, double the figure for the year-earlier
(in EUR million)
period. Foreign capital invested in the sector in the third
9,00
8,5
quarter rose 62% on the previous quarter and accounted
8,00
for 64% of the total in the first nine months. There are
7,00
still large amounts in the pipeline, which look likely to be
6,00
5,6
4,8
5,0
completed by the end of the year. In Rome, after a first half
5,00
4,1
4,2
4,4
4,00
of sluggish investments, around EUR 66 million was invested
3,00
2,6
in the business sector in the third quarter. Despite this
2,00
improvement, investment volumes were still 20% lower than
1,00
-
the same quarter in 2013.
2007
2008
2009
2010
2011
2012
2013
2014E
Source: CBRE
In Milan, vacancies in the third quarter of 2014 were higher
than at end-2013, at 12.9% of the total. In 2014, the supply
In terms of the sector breakdown of investments in the first
of office space increased, thanks to the completion of new
nine months of the year, the retail sector was the most
projects which increased stock by around 7,000 square
attractive sector with almost 50% of total investments
meters.
(i.e. approx. EUR 1.3 billion), although it lost some ground to
the office sector, which came second with 30%.
A similar trend occurred in Rome, where turnover in space
in the third quarter was 21% lower than the quarterly
Investment in the first nine months of 2014 in Italy, by type
average of the previous three years. The total for the first
nine months of 2014 was 54,500 square metres, down 57%
7
%
1
%
year-on-year. The lack of transactions in large-scale units
Hotels
Other
impacted negatively on the annual take-up year-on-year. The
%
30
13
%
office vacancy volume remained stable, at 8.2% of stock.
Uffices
Industry &
Supply in the business market in Rome was static, with
Logistics
almost no speculative development taking place.
In terms of gross returns, prime real estate in both Milan
49
%
and Rome remained stable at 5.75% and 6.25% respectively.
Commercial
In both cases, given the overheated peripheral Irish and
Source: CBRE
Spanish markets, operators are projecting a further squeeze
on returns, especially prime returns, over the coming
Despite a slowdown in the third quarter due to considerably
months.
longer times to completion, which increased the volume
of sales and purchases in the pipeline, interest in retail
Prices in the Italian real estate market continue to erode.
investments remained high. To date, the volume of retail
Since 2008, a significant loss has built up, especially in the
investments in the last quarter is almost EUR 1 billion, and
13 main markets, with falls of 19.2% for new builds, 21%
includes the Roma Est shopping centre, the Fashion District
for offices and 17.7% for stores . In the second half of 2014,
outlet centres, the residual portfolio of the Olindo Fondo Shop
prices fell 1.7% for new builds, 1.7% for offices and 1.7% for
fund and some negotiations over individual centres and high-
stores compared with the first half. Repricing, which started
street stores nearing completion.
with a slight lag compared to the contraction in sales and
purchases, is expected to continue for the next two years,
In the first nine months of 2014, the volume of institutional
albeit at slower pace, before reversing in 2016.
real estate investment in the office sector n Italy was more
than EUR 800 million, of which about half came in the first
quarter alone3.
3. CBRE, Italian Investment Quarterly, Q3 2014
4. Nomisma, 3rd Report on 2014 Property Market
30 DeA Capital - Report on Operations
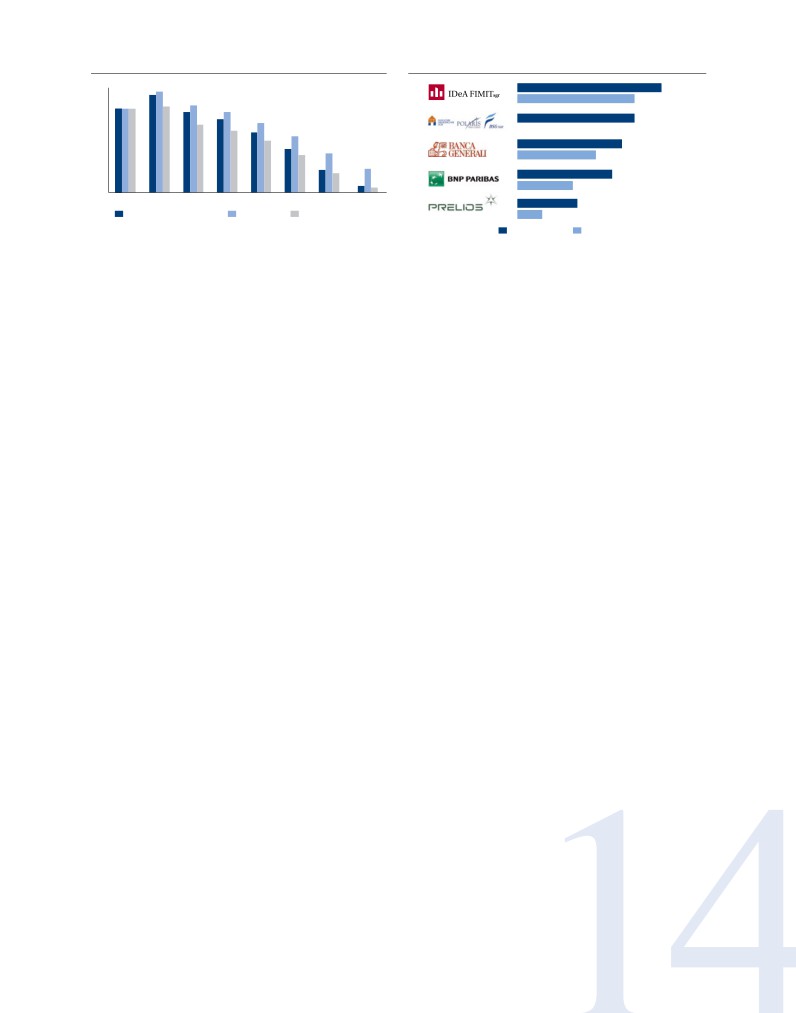
Average prices in Italy's 13 largest cities
AUM of the largest real estate asset managers
(2007 = 100)
(EUR billion)
105
~9,0
1°
6,2
100
~7,0*
2°
95
5,0
90
3°
4,2
85,7
85
5,0
81,7
81,3
4°
2,9
80
2007
2008
2009
2010
2011
2012
2013
2014E
3,2
New or restructured
Retail
New or restructured
5°
1,3
offices
houses
AUM
NAV
Source: Nomisma
* The merger by incorporation into Investire Immobiliare SGR of Beni Stabili Gestioni SGR
and Polaris Real Estate SGR was signed on 19 December 2014. The AUM figure is
based on an estimate of December 2014 figures. The NAV is not available.
Strong competition in some products, especially those located
in the prime areas of Milan and Rome, trimmed 15-25 basis
At the end of the first half of 2014, 75% of funds used
points off prime returns, bringing them back to 2012 levels5.
leverage to increase invested assets.
Reserved funds, which were responsible for the majority
Real Estate funds in Italy
of real estate portfolio movements in the period, bought
or transferred real estate worth around EUR 1.9 billion
Italian real estate funds, with around EUR 51 billion assets
and sold EUR 347 million, falls of 7% and more than 34%,
under management, improved on the EUR 49 billion of
respectively, compared with the previous six months.
20136, despite the lack of any real recovery in the real
Retail funds did not buy or transfer real estate, and sold
estate sector in 2014.
just EUR 150 million, half the amount of the previous six
months.
The first 2014 half-year report on real estate funds
produced by Assogestioni shows that 16 new funds were
Changes in real estate assets net of portfolio movements
launched in the first half of the year; of these, six were
(therefore excluding any sales) also deteriorated further. In
speculative and all except one were reserved for qualified
the first half of 2014, retail fund assets shed 5% in value
or institutional investors only. At the end of the first half
compared with the second half of 2013.
of 2014, 90% of supply in the sector consisted of reserved
Listed Italian real estate funds posted a negative
funds with a net asset value (NAV) of about EUR 22
performance of around 1.3% in 2014, and faced continuing
billion. Retail funds (10% of funds offered) accounted for
problems from the limited liquidity in the sector and heavy
a NAV of just over EUR 4 billion. Ordinary funds set up for
discounting of funds' market prices compared to their NAV.
institutional investors saw the biggest growth in terms of
stock, with assets and NAV rising 20%7.
Over the last six months, the average daily trading volume
in the closed-end listed fund market was around EUR
In June 2014, property and real property rights were
30,500. The market's lack of dynamism continued, with
unchanged from the previous half year at around 89% of
all funds trading at a discount to NAV of almost 45%8.
assets. The percentage by intended use remained practically
However, foreign operators showed considerable interest
unchanged, with 52% of investments concentrated in
in listed Italian real estate funds. This was demonstrated
the office sector; retail properties accounted for 13%,
by the successful public purchase offer (PPO) launched by
residential property 10%, other investments (barracks,
Blackstone on the Atlantic1 fund in March, and the PPO
telephone exchanges and land) 10%, and logistics,
launched by Capstone Equities on the Europea Immobiliare
industrial or hospitality properties the remainder.
1 fund in November, although this did not achieve the
minimum number of subscriptions.
5. BNP Real Estate, Investment in Italy, Q3 2014
6. Scenari Immobiliari, Half-year note, December 2014
7. Assogestioni, Half-yearly report on Italian real estate funds, 1st half of 2014
8. Data from IDeA FIMIT Research Department using Bloomberg figures,
- figure only applies to Italian real estate funds surveyed by Assogestioni
updated as at 16/01/2015
DeA Capital - Annual Financial Statements to 31 December 2014
31
The DeA Capital Group’s investment
Private Equity Investment
portfolio
In terms of shareholdings, at 31 December 2014, the
The structure of the DeA Capital Group's investment
DeA Capital Group was a shareholder of:
portfolio in the Private Equity Investment and Alternative
Asset Management businesses, as defined above, is
• Kenan Investments, the indirect parent company of Migros
summarised in the table below.
(valued at EUR 209.1 million);
• Sigla Luxembourg, the parent company of Sigla (valued at
Investment portfolio
EUR 11.2 million);
• Harvip, which manages funds and investment vehicles
December 31, 2014
used to purchase distressed real estate and other
n.
Euro/Mln.
investments (valued at EUR 0.2 million).
Equity investments
3
220.5
Funds (*)
14
203.0
The DeA Capital Group is also a shareholder in three
Private Equity Investment
17
423.5
companies - i.e. Elixir Pharmaceuticals Inc., Kovio Inc.
and Stepstone - which are not included in the investment
Alternative asset management (*)
4
201.5
portfolio as they are either dormant or in liquidation, and
Investment portfolio
21
625.0
have zero carrying value.
(*) Units in private equity funds consolidated on a line-by-line basis
and equity investments in subsidiaries relating to alternate asset
management are valued in this table using the equity method for the
With regard to funds, at 31 December 2014, the DeA Capital
Group's portion.
Group held units in:
Details on portfolio asset movements in 2014 are provided in
• IDeA I FoF (valued at EUR 93.5 million);
the sections on the Private Equity Investment and Alternative
• ICF II (valued at EUR 35.3 million);
Asset Management businesses below.
• ICF III (valued at EUR 1.7 million);
• IDeA OF I (valued at EUR 56.0 million);
• IDeA EESS (valued at EUR 4.3 million);
• IDeA ToI (value not significant);
• AVA (valued at EUR 2.6 million);
• seven venture capital funds (with a total value of
approximately EUR 9.6 million).
Valuations of shareholdings and funds in the portfolio reflect
estimates made using the information available on the date
this document was prepared.
32 DeA Capital - Report on Operations
Shareholdings in associates
-
SIGLA LUXEMBOURG (PARENT COMPANY OF SIGLA)
INVESTMENT DETAILS:
REGISTERED OFFICE:
On 5 October 2007, DeA Capital Investments
Italy
finalised the acquisition of a stake (currently
41.39%) in Sigla Luxembourg, the holding
SECTOR:
company that fully controls Sigla, which operates
Consumer credit
in Italy and provides consumer credit for non-
In terms of operating performance, Sigla
specific purposes.
recorded a net loss in 2014, a deterioration
WEBSITE:
on the previous year. This was due to the
BRIEF DESCRIPTION:
slowdown in the business of granting personal
Sigla specialises in personal loans and “salary-
loans, which was consistent with the strategy
backed loans”. It is a benchmark operator in
of reducing operating risks, and above all the
the provision of financial services to households
impact of extraordinary items (EUR -2 million
throughout Italy, chiefly through a network of
in 2013).
agents.
However, the raising of over EUR 300 million
The company’s product range of salary-backed
in new funding for without-recourse credit
loans and personal loans was expanded in 2010
facilities with effect from the last quarter of
to include the servicing of portfolios of unsecured
2014, together with an agreement with one of
non-performing loans (personal loans and credit
its major financing banks which significantly
cards).
reduced its risk profile through the release
of existing guarantees on a large portion
The investment in Sigla Luxembourg, which is
of previously granted loans, have laid the
recorded under ‘Shareholdings in associates’, is
foundations for reversing the earnings trend
Innovative operator
worth around EUR 11.2 million in the Consolidated
this year.
Financial Statements for the Year Ending 31
of non-performing
December 2014 (EUR 12.1 million at 31 December
loans
2013). The decrease compared with 31 December
2013 is largely due to the loss made in the period.
Sigla (mln €)
2014
2013 Change
Loans to customers*
41.5
48.5
(7.0)
Revenues from
personal loans
0.9
1.7
(0.8)
Salary-backed loans
granted
96.7
90.8
5.9
Revenues from
salary-backed loans
5.0
5.4
(0.4)
Net profit/(loss)
(2.1)
(0.3)
(1.8)
* Receivables for personal loans net of impairment provisions
DeA Capital - Annual Financial Statements to 31 December 2014
33
Shareholdings in other companies
KENAN INVESTMENTS (INDIRECT PARENT COMPANY OF MIGROS)
REGISTERED OFFICE:
INVESTMENT DETAILS:
Turkey
In 2008, the DeA Capital Group acquired about
17% of the capital of Kenan Investments, the
SECTOR:
company heading the structure to acquire the
Food retail
controlling interest in Migros.
WEBSITE:
BRIEF DESCRIPTION:
Migros was established in 1954, and is the
leading company in the food retail sector in
Turkey. The company has 1,190 outlets
(at 31 December 2014), with a total net sales
This valuation is based on the percentage that DeA
area of approximately 953,000 square metres.
Capital S.p.A. and a Migros share price of:
Migros is present in all seven regions of
(i) TRY 26.00 for the stake in Migros that is
Turkey, and has a marginal presence in
the subject of the transaction with Anadolu
Kazakhstan and Macedonia.
(described in the section ‘Significant Events’
above), i.e. both the 40.25% of Migros shares
The company operates under the following
being sold immediately and the 9.75% of Migros
names: Migros, Tansas and Macrocenter
shares subject to put and call options agreed by
(supermarkets), 5M (hypermarkets),
the parties);
Ramstore (supermarkets abroad) and
(ii) TRY 22.75, being the market price on 31
Kangurum (online store).
December 2014, for the remaining stake
(30.5% of Migros capital).
Leading company
Growth in the food retail sector in Turkey is a
in the food retail
relatively recent phenomenon, brought about
The increase of EUR 76.7 million versus 31
by the transition from traditional systems
December 2013 was due to the above-mentioned
sector in Turkey
such as bakkals (small stores typically run
rise in the value of Migros shares (compared with
by families) to an increasingly widespread
TRY 16.00 per share at 31 December 2013) and
organised distribution model driven by
the appreciation of the Turkish lira against the euro
expansion and the modernisation process
(2.83 TRY/EUR at 31 December 2014 versus 2.97
under way in Turkey.
TRY/EUR at 31 December 2013).
The investment in Kenan Investments is
The effect on the DeA Capital Group’s NAV
recorded in the Consolidated Financial
of this change in fair value was partially offset
Statements for the Year Ending 31 December
by the reduction in estimated carried interest to
2014 at EUR 209.1 million (compared with EUR
be paid, based on the total capital gain
132.4 million at 31 December 2013).
(EUR -11.4 million).
34 DeA Capital - Report on Operations
Migros (mln YTL)
2014
2013
Chg. %
Revenues
8,123
7,127
14.0%
EBITDA
532
469
13.4%
Group net profit/(loss)
99
(463)
n.a.
Net debt
(1,663)
(1,883)
+220 mln YTL
Looking at the global picture, the Turkish economy
(186 new supermarkets in 12 months). This
grew by 3.0% year-on-year in 2014, a slowdown
performance translates into improved profit
on the figure of 4.0% for the whole of 2013.
margins. The sharp increase in the Group's
Inflation was 8.9%, up from 7.4% for 2013.
net profit compared with 2013 reflects the
negative impact in that year of revaluing the
After a peak in volatility in January 2014,
company's debt in euro. The increase in net
following on from the turbulence in 2013, the
debt relates to the impact of the TRY/EUR
TRY/EUR exchange rate stabilised in February.
exchange rate trends on the portion of debt
This was due to monetary policy measures
that is denominated in euro.
introduced by the Turkish Central Bank,
combined with the impact of the results of the
Note that Migros has confirmed its intention,
administrative elections at the end of March
for the medium term, to maintain a sustained
2014 and of the presidential elections in August
rate of expansion of its network, by opening
2014, which gave the governing party a vote
150-200 new supermarkets a year, with a
of confidence. Further political elections are
focus on areas of 200-350 square metres
scheduled for summer 2015, which will be an
(with a particular emphasis on fresh products,
important factor in the country’s economic and
a growing proportion of private label products
currency stability.
and a much broader choice than offered
by discount stores). At the same time, the
The food retail sector in Turkey remained buoyant
company confirmed double-digit revenue
in 2014, with sustained growth in commercial
growth guidance and an EBITDA margin in the
space (+9.4%) and the supermarket segment
6% to 6.5% range.
(+2.7% yoy), which maintained its dominant
position.
In terms of operating performance, Migros grew
revenues by 14.0% year-on-year; this was partly
driven by the expansion of the sales network
DeA Capital - Annual Financial Statements to 31 December 2014
35

Funds
At 31 December 2014, the DeA Capital Group’s Private
another seven venture capital funds, totalling approximately
Equity Investment business included investments - other
EUR 203.0 million (corresponding to the estimated fair value
than the investment in the IDeA OF I fund (fully consolidated
calculated using the information available on the date this
in accordance with IFRS 10) and the AVA real estate fund
document was prepared).
(classified under ‘Investments in associates’, based on the
units held) - in three funds of funds (IDeA I FoF, ICF II and
Residual commitments for all the funds in the portfolio were
ICF III), two theme funds (IDeA EESS and IDeA ToI) and
approximately EUR 107.7 million.
36 DeA Capital - Report on Operations
IDeA OF I
IDEA OPPORTUNITY FUND I >>
INVESTMENT DETAILS:
REGISTERED OFFICE:
IDeA OF I is a closed-end fund under Italian law
subscribing to a reserved capital increase.
Italy
for qualified investors, which began operations
This company is Italy’s leading integrated
on 9 May 2008, and is managed by IDeA Capital
facility management company, providing
SECTOR:
Funds SGR.
and managing a wide range of property
Private equity
management services and other services
At its meeting on 20 July 2011, the Board of
for individuals and government agencies.
WEBSITE:
Directors of IDeA Capital Funds SGR approved a
on 2 July 2013, IDeA OF I sold a 1% stake
number of regulatory changes. These included
in the company’s capital to the controlling
changing the name of the IDeA Co-Investment
shareholder (Manutencoop Società
Fund I to IDeA Opportunity Fund I (IDeA OF
Cooperativa), backed by the issue of a three-
I) and extending investment opportunities to
year remunerated vendor note, thereby
qualified minority interests, independently or via
reducing its own stake to 3%;
syndicates.
- on 31 March 2009, it acquired a 17.43%
The DeA Capital Group has a total commitment of
stake in Grandi Navi Veloci S.p.A., an Italian
up to EUR 101.8 million in the fund.
shipping company that transports passengers
and goods on various routes around the
BRIEF DESCRIPTION:
Mediterranean Sea. On 2 May 2011, with
IDeA OF I has total assets of approximately
the finalisation of Marinvest's entry into the
EUR 217 million. Its objective is to invest via
shareholder structure of Grandi Navi Veloci
syndicates with a lead investor, independently or
S.p.A. through the subscription of a reserved
Fund size:
by purchasing qualified minority interests.
capital increase, the stake held by IDeA OF
I was diluted to 9.21%. Subsequently, IDeA
At 31 December 2014, IDeA OF I had called up
OF I’s decision not to subscribe, on a pro-rata
217 million
79.4% of the total commitment and distributed
basis, to two further capital increases (August
6.0% of that commitment, after making nine
2012, January 2014) led to a further dilution
Euro
investments:
in its shareholding to the current 3.12%;
- on 8 October 2008, it acquired a 5% stake in
- on 10 February 2011, it invested in bonds
Giochi Preziosi S.p.A., a company active in the
convertible into shares of Euticals S.p.A.,
production, marketing and sale of children’s
Italian leader in the production of active
games with a product line covering childhood to
ingredients for pharmaceutical companies
early adolescence;
that operate in the generics sector. As part
of the extraordinary operation that led to the
- on 22 December 2008, it acquired a 4% stake
transfer of the controlling share in Euticals
in Manutencoop Facility Management S.p.A. by
S.p.A., on 3 April 2012, these bonds were
DeA Capital - Annual Financial Statements to 31 December 2014
37

IDEA OF I
transferred into the acquisition vehicle, Lauro
- on 9 October 2012, IDeA OF I acquired an
57, which now owns 100% of Euticals S.p.A.;
indirect stake of 4.6% in Patentes Talgo S.A.
in exchange, a stake of 7.77% was acquired
(Talgo), a Spanish company that designs and
in the same acquisition vehicle. Subsequent
produces solutions for the rail sector, chiefly sold
to 31 December 2014, on 13 February 2015,
on the international market (high-speed trains,
a capital increase was agreed for a total of
and maintenance vehicles and systems);
EUR 17.5 million, divided into three tranches.
The first tranche of EUR 12.5 million is
- on 12 December 2012, IDeA OF I acquired
scheduled for the end of March 2015 (of
a stake of 29.34% in 2IL Orthopaedics, a
which about EUR 1.0 million for IDeA OF I);
Luxembourg-registered vehicle which, through
an initial purchase offer and subsequent delisting
- on 25 February 2011, it purchased a 9.29%
of previously listed shares, obtained full control
stake in Telit Communications PLC (Telit), the
(on 15 February 2013) of English company
third-largest producer of machine-to-machine
Corin Group PLC (Corin). Corin is active in the
communications systems in the world. The
production and marketing of orthopaedic devices,
stake held by IDeA OF I was subsequently
especially for hips and knees;
diluted to 8.53% due to the exercise of stock
options by the company's management. The
- on 27 February 2013, the fund acquired a
sale of a portion of Telit's shares held by IDeA
stake of 10% in Elemaster S.p.A. (Elemaster),
OF I was launched in 2014 at a price of EUR
the leading operator in ODM (original
11.2 million, generating a 3.2 times return on
design manufacturing) and EMS (electronic
the original investment. Following the sale,
manufacturing service), i.e. the design and
IDeA OF I now owns 5.0% of Telit;
construction of electronic equipment. At the same
time, the IDeA Efficienza Energetica e Sviluppo
- on 11 September 2012, an agreement was
Sostenibile Fund, also managed by IDeA Capital
signed with the main shareholder, Filocapital
Funds SGR, invested an equal amount.
S.r.l., for an investment in Iacobucci HF
Electronics S.p.A. (Iacobucci), a company
that manufactures trolleys for aeroplanes
and trains, and specialises in the design,
production and marketing of components for
aircraft fittings and furnishings. At the date
of this document, the investment in Iacobucci
consists of a stake of 34.85%, subscribed
following two reserved capital increases on
7 August 2013 (EUR 3 million) and 19 May
2014 (EUR 3 million), and the conversion of
a bond into shares of Iacobucci, for EUR 6
million, which took place on 10 October 2014;
38 DeA Capital - Report on Operations
The units held in IDeA OF I were reported in the
EUR 5.1 million and a pro-rata net gain for the
Consolidated Financial Statements for the Year
period of EUR 1.4 million.
Ending 31 December 2014 at EUR 56.0 million,
versus EUR 56.9 million at 31 December 2013.
The table below shows a breakdown of the
The change is attributable to capital calls of
fund’s NAV at 31 December 2014.
EUR 2.8 million, capital reimbursements of
NAV of IDeA OF I at 31 December 2014
100%
DeA Capital
(EUR million)
stake
stake
Portfolio investments
Giochi Preziosi
10.0
4.7
Manutencoop Facility Management
18.9
8.9
Grandi Navi Veloci
4.5
2.1
Lauro Cinquantasette (Euticals)
11.8
5.6
Telit Communications
17.5
8.2
Iacobucci HF Electronics
12.0
5.6
Pegaso Transportation Investments (Talgo)
15.0
7.0
2IL Orthopaedics LTD (Corin)
12.8
6.0
Elemaster
8.5
4.0
Total Portfolio Investments
111.0
52.2
Other long-term receivables
7.0
3.3
Cash and cash equivalents
1.1
0.5
Total shareholders' equity
119.1
56.0
The table below shows the key figures for IDeA OF I at 31 December 2014.
IDeA OF I
Registered
Year of
Fund Subscribed
% DeA Capital
EUR (€)
office commitment
size commitment
in fund
IDeA Opportunity
Fund I
Italy
2008
216,550,000
101,750,000
46.99
Residual
Commitments
Total residual
commitment in:
Euro
20,980,850
DeA Capital - Annual Financial Statements to 31 December 2014
39
IDeA I FoF
IDEA I FUND OF FUNDS
REGISTERED OFFICE:
INVESTMENT DETAILS:
Italy
IDeA I FoF is a closed-end fund under Italian
At the date of the latest report available, the
law for qualified investors, which began
IDeA I FoF portfolio was invested in 42 funds with
SECTOR:
operations on 30 January 2007 and is managed
different investment strategies; these funds in
Private equity
by IDeA Capital Funds SGR.
turn hold 419 positions, with varying maturities,
in companies active in geographical regions with
WEBSITE:
The DeA Capital Group has a total commitment
different growth rates.
of up to EUR 173.5 million in the fund.
The funds are diversified in the buy-out (control)
and expansion (minorities) categories, with
BRIEF DESCRIPTION:
overweighting towards medium- and small-scale
IDeA I FoF, which has total assets of
transactions and special situations (distressed
approximately EUR 681 million, invests its
debt/equity and turnaround).
assets in units of unlisted closed-end funds
that are mainly active in the local private
At 31 December 2014, IDeA I FoF had called up
equity sector in various countries. It optimises
81.2% of its total commitment and had made
Fund size:
the risk-return profile through careful
distributions totalling approximately 47.6% of that
diversification of assets among managers with
commitment.
681 million
a proven track record of returns and solidity,
different investment approaches, geographical
Euroareas and maturities.
40 DeA Capital - Report on Operations
OTHER IMPORTANT INFORMATION:
Below is an analysis of the portfolio, updated to the
year of investment, geographical area, sector
date of the latest report available, broken down by
and type.
Breakdown by vintage1 (%)
Breakdown by geography2 (%)
2013
2014
5
1
2000-2006
10
Global
2012
21
11
2007
13
Europe
2011
RoW
45
15
14
2008
11
2010
22
2009
11
US
21
Breakdown by industry1 (%)
Breakdown by type2 (%)
Cons.
Distressed
Discretionary
Portfolio
Large
12
5
Special
Buyout
Cons.
Situations
16
Materials
Staples
19
7
7
Energy
Healthcare
Expansion
14
5
9
Pharma 2
VC
Transportation
Financials 5
5
Mid
6
Media 4
Buyout
Industrials
Asset Based PE
31
8
IT 18
6
Small Buyout
RE 2
Leisure 6
14
Notes:
1. % of the FMV of the investment at 31 December 2014;
2. % of fund size based on paid-in exposure (capital invested + residual commitments) at 31 December 2014.
The units in IDeA I FoF had a value of
capital reimbursements of EUR 21.4 million
approximately EUR 93.5 million in the
and an increase in fair value of
Consolidated Financial Statements for the
EUR 16.7 million.
Year Ending 31 December 2014 (EUR 94.7
million at 31 December 2013). The increase
The table below shows the key figures for
was due to capital calls of EUR 3.5 million,
IDeA I FoF at 31 December 2014.
IDeA I FoF
Registered
Year of
Fund Subscribed % DeA Capital
EUR (€)
office commitment
size commitment
in fund
IDeA I Fund of Funds
Italy
2007
681,050,000
173,500,000
25.48
Residual
Commitments
Total residual
commitment in:
Euro
32,600,642
DeA Capital - Annual Financial Statements to 31 December 2014
41
ICF II
ICF II
REGISTERED OFFICE:
INVESTMENT DETAILS:
Italy
ICF II is a closed-end fund for qualified
The fund started building its portfolio by focusing
investors under Italian law, which began
on funds in the area of mid-market buy-
SECTOR:
operations on 24 February 2009 and is
outs, distressed and special situations, loans,
Private equity
managed by IDeA Capital Funds SGR.
turnarounds and funds with a specific sector slant,
targeting in particular opportunities offered in the
WEBSITE:
The DeA Capital Group has a total commitment
secondary market.
of up to EUR 51 million in the fund.
At the date of the latest report available, the ICF
BRIEF DESCRIPTION:
II portfolio was invested in 27 funds with different
ICF II, with total assets of EUR 281 million,
investment strategies; these funds in turn hold
invests in units of unlisted closed-end funds
positions, with varying maturities, in around 304
that are mainly active in the local private
companies active in geographical regions with
equity sector of various countries. It optimises
different growth rates.
Fund size:
the risk-return profile through careful
diversification of assets among managers with
At 31 December 2014, ICF II had called up
a proven track record of returns and solidity,
63.9% of its total commitment and had made
281 million
different investment approaches, geographical
distributions totalling approximately 12.4%
areas and maturities.
of that commitment.
Euro
OTHER IMPORTANT
INFORMATION:
Below is an analysis of the portfolio, updated to
the date of the latest report available, broken
down by year of investment, geographical area,
sector and type.
42 DeA Capital - Report on Operations
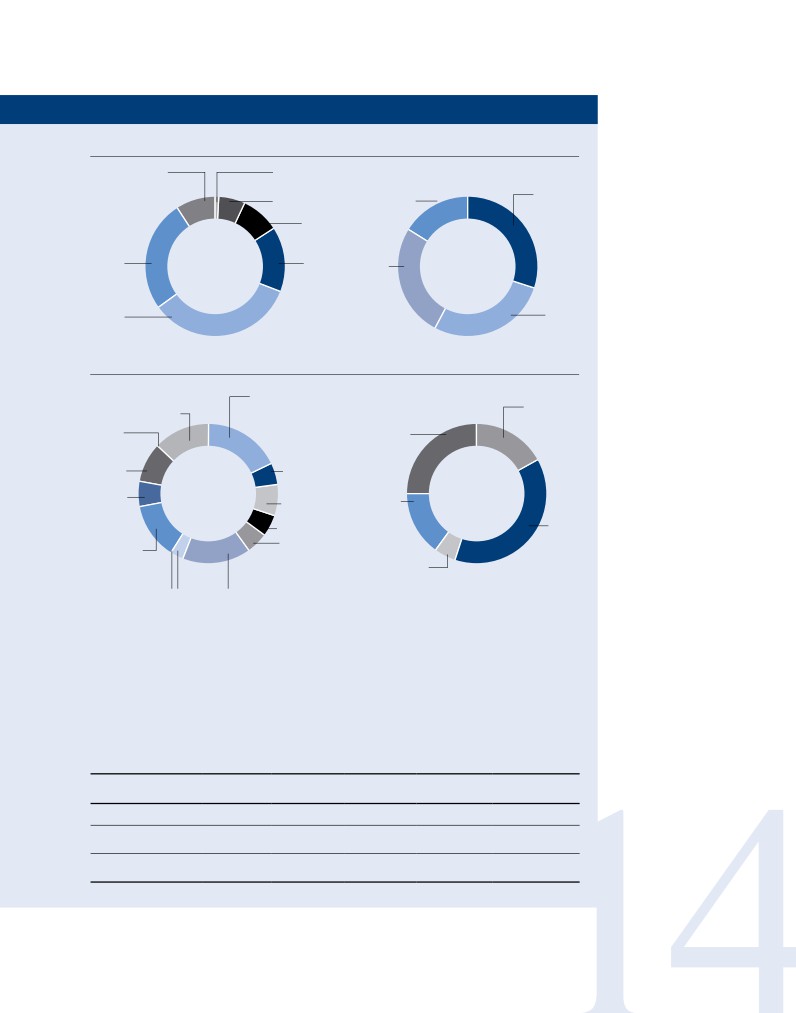
Breakdown by vintage1 (%)
Breakdown by geography2 (%)
2014
2004-2008
9
1
Europe
2009
Global
30
6
16
2010
9
2013
2011
RoW
26
15
26
2012
US
34
28
Breakdown by industry1 (%)
Breakdown by type2 (%)
Cons.
Distressed
Discretionary 18
Large
Portfolio
Buyout
13
17
Other
Special
0
Situations
25
Energy
Cons.
9
Staples 5
Materials
Healthcare 7
Expansion
6
15
Small /
Financials 5
Mid
Media 5
Buyout
Industrial
38
13
VC
5
RE
0
Leisure 3
IT 16
Notes:
1. % of the FMV of the investment at 31 December 2014;
2. % of fund size based on paid-in exposure (capital invested + residual commitments) at 31 December 2014.
The units in ICF II had a value of approximately
capital reimbursements of EUR 2.9 million and
EUR 35.3 million in the Consolidated Financial
an increase in fair value of EUR 7.1 million.
Statements for the Year Ending 31 December 2014
(EUR 23.8 million at 31 December 2013). The
The table below shows the key figures for ICF
increase was due to capital calls of EUR 7.3 million,
II at 31 December 2014:
ICF II
Registered
Year of
Fund Subscribed % DeA Capital
EUR (€)
office commitment
size commitment
in fund
ICF II
Italy
2009
281,000,000
51,000,000
18.15
Residual
Commitments
Total residual
commitment in:
Euro
18,386,037
DeA Capital - Annual Financial Statements to 31 December 2014
43
ICF III
ICF III
REGISTERED OFFICE:
DETTAGLI INVESTIMENTO:
Italy
ICF III is a closed-end fund for qualified
• Credit & Distressed, which invests in special
investors under Italian law, which began
credit operations (preferred equity, mezzanine,
SECTOR:
operations on 10 April 2014 and is managed
senior loans), turnarounds and other credit
Private Equity
by IDeA Capital Funds SGR.
strategies;
• Emerging Markets, which focuses on expansion
WEBSITE:
The DeA Capital Group has a total
capital, buy-outs, distressed assets and venture
commitment of up to EUR 12.5 million in the
capital operations in emerging markets.
fund.
At 31 December 2014, ICF III had called up
BRIEF DESCRIPTION:
27.4%, 24.0% and 7.0% in the Core, Credit
ICF III, which at the first closing had total
& Distressed and Emerging Markets segments
assets of EUR 57 million, intends to invest its
respectively.
assets in units of closed-end private equity
funds or in schemes that replicate the financial
The ICF III units are valued at approximately EUR
Fund size:
model, either as lead investor or with other
1.7 million in the Consolidated Financial Statements
co-investors.
for the Year Ending 31 December 2014, which
corresponds to investments of EUR 1.8 million and a
57 million
The fund is divided into three segments:
decrease in fair value of EUR 0.1 million.
Euro
• Core, with a focus on buy-outs, expansion
The table below shows the key figures for ICF III at
capital, and special situations;
31 December 2014.
ICF III
Registered
Year of
Fund Subscribed % DeA Capital
EUR (€)
office commitment
size commitment
in fund
ICF III
Italia
2014
57,050,000
12,500,000
21.91
of which:
Core segment
25,400,000
1,000,000
3.94
Credit & Distressed
segment
16,650,000
4,000,000
24.02
Emerging Markets
15,000,000
7,500,000
50.00
Total Residual
Commitments
Total residual
commitment in:
Euro
10,723,428
44 DeA Capital - Report on Operations

IDeA EESS
IDEA EFFICIENZA ENERGETICA E SVILUPPO SOSTENIBILE >>
INVESTMENT DETAILS:
REGISTERED OFFICE:
IDeA EESS is a closed-end fund under Italian law
increases totalling EUR 1.0 million;investment
Italy
for qualified investors, which began operating on
entirely impaired at 31 december 2014. To
1 August 2011 and is managed by IDeA Capital
be pointed out that on 9 march 2015, in
SECTOR:
Funds SGR.
consideration of the gradual deterioration of
Private Equity
the financial situation of the company, the
The DeA Capital Group has a total commitment in
latter was liquidated.
WEBSITE:
the fund of EUR 15.3 million.
- on 27 February 2013, the fund invested
BRIEF DESCRIPTION:
EUR 8.5 million to acquire a stake of 10%
IDeA EESS is a closed-end mutual fund under
in Elemaster, the leading operator in ODM
Italian law for qualified investors, which seeks
(original design manufacturing), and EMS
to acquire minority and controlling interests
(electronic manufacturing service), i.e.
in unlisted companies in Italy and abroad, by
the design and construction of electronic
investing jointly with local partners.
equipment. At the same time, the IDeA OF
I fund, also managed by IDeA Capital Funds
Fund size:
The fund is dedicated to investing in small
SGR, invested an equal amount;
and medium-sized manufacturing and service
companies operating in the field of energy
- on 23 April 2013, the fund invested EUR
100 million
savings and the efficient use of natural
3.5 million to acquire a 29.9% stake in
resources. It focuses on the development of
SMRE, which specialises in the design and
Euro
faster and cheaper solutions in the use of
construction of industrial systems to cut
renewable energy sources while continuing to
and process fabric, and also has know-
reduce CO2 emissions effectively, against a
how in electrical drives with particularly
backdrop of sustained growth in global energy
innovative technology in integrated electric
demand.
transmission. The acquisition was conducted
via subscription to a reserved capital increase
At 31 December 2014, IDeA EESS had called up
in SMRE;
40.8% of its total commitment from subscribers,
after making five investments:
- on 27 December 2013, the fund invested EUR
3.9 million in the special purpose acquisition
- on 8 May 2012, the fund made its first
company (SPAC) GreenItaly 1, of which EUR
investment, acquiring 48% of Domotecnica
3.5 million was in ordinary shares, which
Italiana (independent Italian franchising of
entitle it to 10% of the company, and EUR
thermo-hydraulic installers) for approximately
0.4 million, in its capacity as promoter of
EUR 2.6 million, as well as subsequent capital
the vehicle, in special shares without voting
DeA Capital - Annual Financial Statements to 31 December 2014
45

IDEA EFFICIENZA ENERGETICA E SVILUPPO SOSTENIBILE
rights. The aim of GreenItaly 1, a themed
The investment involves another capital
SPAC, is to acquire a non-listed medium-
increase (for around EUR 2 million) when certain
sized Italian company operating in the
conditions arise and contains a purchase price
efficient use of resources, efficient energy or
adjustment mechanism. Baglioni is a company
environmental sector within 24 months of the
involved in the design and manufacture of
IPO (completed on 27 December 2013);
compressed air tanks for applications across a
broad spectrum of industrial sectors.
- on 13 February 2014, the fund invested EUR
7.8 million relating to a first tranche in Meta
The units in IDeA EESS had a value of
System and in one of its affiliates (Meta
approximately EUR 4.3 million in the Consolidated
System Investment), followed in April and
Financial Statements for the Year Ending
May 2014 by two further tranches totalling
31 December 2014 (EUR 3.0 million at
EUR 4.7 million. The fund’s total investment
31 December 2013). The increase was the
was EUR 12.5 million, for a 16.0% stake
combined effect of capital calls of EUR 2.2 million
in Meta System. Meta System is active in
and a mark to market of EUR -0.9 million.
the production of transmission equipment,
electronic antennas, alarm systems for the
The table below shows the key figures for IDeA
automotive sector, as well as home telematics
EESS at 31 December 2014.
systems and battery chargers for electric
vehicles;
- on 5 February 2015, the fund made its sixth
investment, acquiring a shareholding in
Baglioni via a first capital increase of EUR 8
million for a 35.9% stake in the company.
IDeA EESS
Registered
Year of
Fund Subscribed % DeA Capital
EUR (€)
office commitment
size commitment
in fund
IDeA Efficienza
Energetica e Sviluppo
Sostenibile
Italia
2011
100,000,000
15,300,000
15.30
Residual
Commitments
Total residual
commitment in:
Euro
9,060,630
46 DeA Capital - Report on Operations
IDeA ToI
IDEA TASTE OF ITALY
INVESTMENT DETAILS:
REGISTERED OFFICE:
IDeA ToI is a closed-end fund under Italian law for
primary and secondary (processed) products
Italy
qualified investors, which began operating on 30
or related services.
December 2014 and is managed by IDeA Capital
SECTOR:
Funds SGR.
Given the fund's target total volume of up to
Private equity
EUR 200 million, IDeA Capital Funds SGR has
The DeA Capital Group has a total commitment in
already initiated contacts for the first potential
WEBSITE:
the fund of EUR 8.6 million.
investments.
At 31 December 2014, IDeA ToI had called
BRIEF DESCRIPTION:
up 1.1% of the total commitment from
IDeA ToI is a closed-end mutual fund under Italian
subscribers.
law for qualified investors, which seeks to acquire
minority and controlling interests in mainly small
At 31 December 2014, the value of the
and medium-sized enterprises in Italy, also by
units in IDeA ToI was the combined effect
investing with other co-investors.
of payments of EUR 0.1 million on the first
closing and a decrease in fair value of
The fund is dedicated to investing in companies
EUR 0.1 million.
operating in the agricultural foods sector,
especially areas involved in the production and
The table below shows the key figures for
distribution of foodstuffs in the form of both
IDeA ToI at 31 December 2014.
Fund size:
IDeA ToI
Registered
Year of
Fund Subscribed % DeA Capital
EUR (€)
office commitment
size commitment
in fund
86 million
IDeA Taste of Italy
Italy
2014
86,350,000
8,600,000
9.96
Residual
Commitments
Euro
Total residual
commitment in:
Euro
8,508,667
DeA Capital - Annual Financial Statements to 31 December 2014
47
AVA
ATLANTIC VALUE ADDED
REGISTERED OFFICE:
INVESTMENT DETAILS:
Italy
The “Atlantic Value Added Closed-End
On 29 December 2011, the fund made its first
Speculative Real Estate Mutual Fund” is a
investment totalling EUR 41.5 million through the
SECTOR:
mixed-contribution fund for qualified investors
purchase/subscription of units in the Venere Fund,
Private Equity - Real Estate
that began operations on 23 December 2011.
a closed-end speculative reserved real estate fund
managed by IDeA FIMIT SGR. The Venere Fund's
WEBSITE:
DeA Capital subscribed to a commitment in the
real estate portfolio consists of 16 properties
fund of up to EUR 5 million (corresponding to
primarily for residential use located in northern Italy.
9.1% of the total commitment), with payments
of approximately EUR 3.4 million already made
The units in the AVA fund had a value of
at 31 December 2014.
approximately EUR 2.6 million in the Consolidated
Financial Statements for the Year Ending
31 December 2014 (compared with EUR 2.2
BRIEF DESCRIPTION:
million at 31 December 2013). The increase was
The fund, which is managed by the subsidiary
the combined effect of net investments of
IDeA FIMIT SGR and has a commitment of
EUR 0.7 million and a pro rata share (EUR -0.3
around EUR 55 million, began its operations
million) of the net loss for the period.
with a primary focus on real estate investments
in the office and residential markets.
The table below shows the key figures for the AVA
The duration of the fund is eight years.
fund at 31 December 2014.
AVA
Registered
Year of
Fund Subscribed
% DeA Capital
Fund size:
EUR (€)
office commitment
size commitment
in fund
Atlantic Value Added
Italia
2011
55,000,000
5,000,000
9.08
55 million
Residual
Commitments
Euro
Total residual
commitment in:
Euro
1,620,000
48 DeA Capital - Report on Operations
UNITS IN VENTURE CAPITAL FUNDS
- Units in venture capital funds
effect of net disposals of EUR 0.2 million and
The units in venture capital funds had a total
the decrease in fair value of EUR 0.9 million.
value of approximately EUR 9.6 million in
the Financial Statements for the Year Ending
The table below shows the key figures for
31 December 2014 (EUR 10.7 million at 31
venture capital funds in the portfolio at
December 2013). The increase was the combined
31 December 2014.
Venture
capital fund
Registered
Year of
Subscribed
% DeA Capital
Dollars (USD)
office
commitment Fund size
commitment
in fund
Doughty Hanson & Co
Technology
UK EU
2004
271,534,000
1,925,000
0.71
GIZA GE Venture
Delaware
Fund III
U.S.A.
2003
211,680,000
10,000,000
4.72
Cayman
Israel Seed IV
Islands
2003
200,000,000
5,000,000
2.50
Pitango Venture
Delaware
Capital II
U.S.A.
2003
125,000,000
5,000,000
4.00
Pitango Venture
Delaware
Capital III
U.S.A.
2003
417,172,000
5,000,000
1.20
Total dollars
26,925,000
EUR (€)
Nexit Infocom 2000
Guernsey
2000
66,325,790
3,819,167
5.76
Sterling (GBP)
Amadeus Capital II
UK EU
2000
235,000,000
13,500,000
5.74
Residual
Commitments
Total residual
commitment in:
Euro
4,608,851
DeA Capital - Annual Financial Statements to 31 December 2014
49
Alternative Asset Management
At 31 December 2014, DeA Capital S.p.A. was the owner of:
• 100% of IDeA Capital Funds SGR;
• 64.30% of IDeA FIMIT SGR (including 61.30% held through DeA Capital Real Estate and the remaining
3.00% directly);
• 96.99% of IRE/IRE Advisory (which operates in project, property and facility management and real
estate brokerage).
IDEA CAPITAL FUNDS SGR
REGISTERED OFFICE:
INVESTMENT DETAILS:
Italy
IDeA Capital Funds SGR operates in the
• Geographical area (Europe, US and the Rest of
management of private equity funds (funds of
the World);
SECTOR:
funds, co-investment funds and theme funds).
• Maturity (commitments with investment periods
Alternative
At 31 December 2014, the asset management
diluted over time).
Asset Management -
company managed seven closed-end private
Private Equity
equity funds, including four funds of funds
The investment strategies of the “direct” co-
(IDeA I FoF, ICF II and ICF III, and IDeA
investment fund focus on minority interests in
WEBSITE:
Crescita Globale, which targets the retail
businesses that primarily concentrate on Europe,
market), a “direct” co-investment fund (IDeA
and diversification as a function of the appeal of
OF I) and two theme funds (IDeA EESS, which
individual sectors by limiting investments during
operates in energy efficiency, and IDeA ToI, in
the early stage.
the agricultural foods sector).
The investment philosophy of the IDeA EESS
The investment programmes of IDeA Capital
sector fund focuses on growth capital and buyout
Funds SGR, which are regulated by the
private equity to support the growth of small
Asset under
Bank of Italy and Consob, leverage the
and medium-sized enterprises with excellent
management team's wealth of experience in
products/services in the energy efficiency and
management:
the sector.
sustainable development arena. Investments in
1.5 billion Euro
infrastructure for the generation of energy from
The investment strategies of the funds of
renewable sources or early stage investments
funds focus on building a diversified portfolio
can be made in compliance with regulatory
in private equity funds in the top quartile or
restrictions.
that are next-generation leaders with balanced
asset allocation through diversification by:
The investment target of the IDeA ToI sector
fund is small to medium-sized enterprises
• Industrial sector;
operating in the agricultural foods industry
• Investment strategy and stage (buy-outs,
through operations in development capital and
venture capital, special situations, etc.);
early-stage buy-outs.
50 DeA Capital - Report on Operations
The table below summarises the value of assets under management and management fees for
IDeA Capital Funds SGR at 31 December 2014.
Assets Under
Management
Management at
fees at
(EUR million)
31 December 2014
31 December 2014
IDeA Capital Funds SGR
IDeA I FoF
681
4.6
IDeA OF I
217
2.5
ICF II
281
2.5
IDeA EESS
100
2.0
IDea Crescita Globale
55
1.4
ICF III
57
0.5
IDeA Taste of Italy
86
0.9
Total IDeA Capital Funds SGR
1,477
14.4
With regard to operating performance, the
April 2014 and the IDeA ToI fund (EUR 86
company recorded a year-on-year increase of
million) in December 2014. The company had
approximately EUR 143 million in assets under
recorded one-off receipts of EUR 1.5 million
management in 2014, which was due to the
under management fees in April 2013, due to
launch of the ICF III fund (EUR 57 million) in
the final closing of the EESS fund.
IDeA Capital Funds SGR
(EUR million)
2014
2013
AUM
1,477
1,334
Management fees
14.4
14.2
Net profit/(loss)
3.6
4.0
DeA Capital - Annual Financial Statements to 31 December 2014
51
IDEA FIMIT SGR
REGISTERED OFFICE:
INVESTMENT DETAILS:
Italy
IDeA FIMIT SGR is the biggest independent
real estate asset management company in
SECTOR:
Italy, with around EUR 9.0 billion in assets
Alternative
under management and 36 managed funds
Asset Management -
(including five listed funds). This puts it
Real Estate
among the major partners of Italian and
international investors in promoting, creating
WEBSITE:
and managing closed-end mutual real estate
investment funds.
IDeA FIMIT SGR undertakes three main lines
of business:
• the development of mutual real estate
investment funds designed for institutional
clients and private investors;
• the promotion of innovative real estate
financial instruments to satisfy investors’
increasing demands;
• the professional management (technical,
specialises in “core” and “core plus” properties,
administrative and financial) of real estate
but its major investments also include major
funds with the assistance of in-house experts
“value added” transactions.
Asset under
as well as the best independent technical,
legal and tax advisors on the market.
Due in part to successful transactions concluded in
management:
recent years, the asset management company is
9.0 billion Euro
The company has concentrated investments in
able to rely on a panel of prominent unit-holders
transactions with low risk, stable returns, low
consisting of Italian and international investors
volatility, simple financial structures and, most
with a high standing, such as pension funds, bank
importantly, an emphasis on real estate value.
and insurance groups, capital companies and
In particular, the asset management company
sovereign funds.
52 DeA Capital - Report on Operations

The table below summarises the value of assets
under management and management fees for
IDeA FIMIT SGR at 31 December 2014.
Assets under
Management
management at
fees at
EUR million
31 December 2014
31 December 2014
Fund Breakdown
Atlantic 1
626
3.7
Atlantic 2 Berenice
199
1.5
Alpha
432
4.3
Beta
136
2.5
Delta
221
2.5
Listed funds
1,614
14.5
Reserved funds
7,369
39.6
Total IDeA FIMIT SGR
8,983
54.1
DeA Capital - Annual Financial Statements to 31 December 2014
53
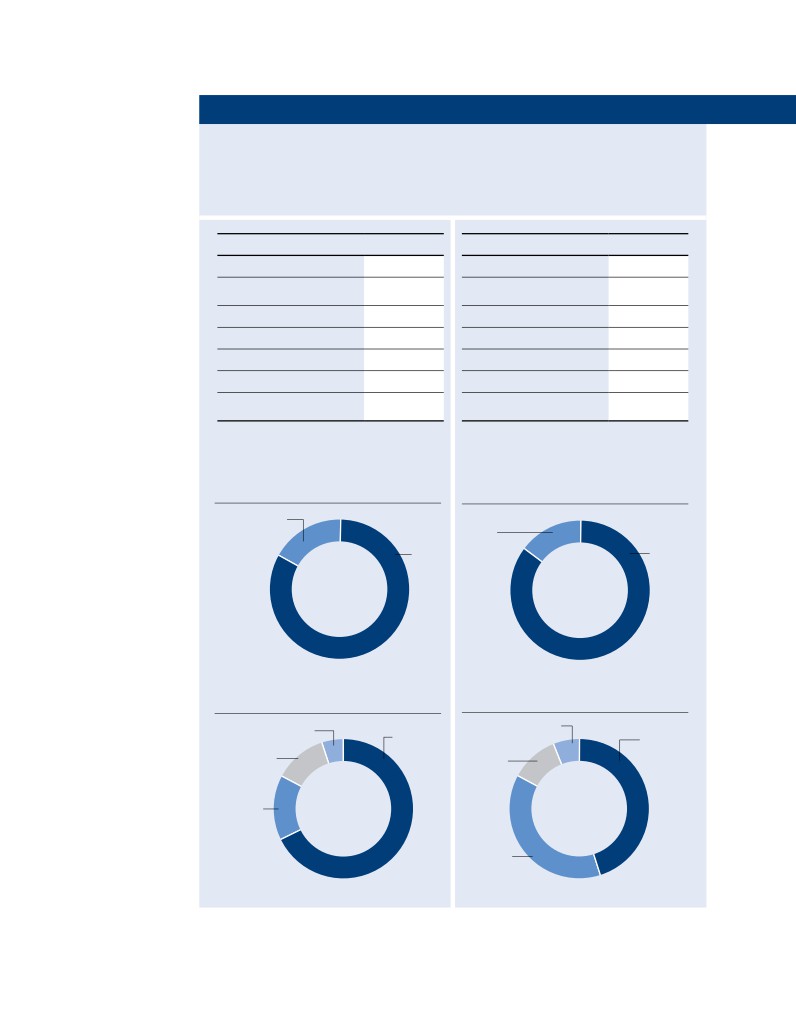
Some of the key financials of the listed
the latest report available, broken down
funds in the asset management portfolio
by geographical area and by intended use.
are also provided below, with an analysis
broken down by geographical area and by
of the real estate portfolio at the date of
intended use.
Atlantic 1
31.12.2014
Atlantic 2 - Berenice
31.12.2014
Market value of properties
586,120,000
Market value of properties
170,986,000
Historical cost and
Historical cost and
capitalised charges
610,602,375
capitalised charges
192,865,503
Financing
344,658,723
Financing
80,000,000
Net Asset Value (NAV)
265,935,162
Net Asset Value (NAV)
109,171,181
NAV/unit (EUR)
509.9
NAV/unit (EUR)
182.0
Market price/unit (EUR)
318.5
Market price/unit (EUR)
128.0
Dividend yield from
Dividend yield from
investment*
5.68%
investment*
9.67%
* Ratio of income per unit to annual average nominal
* Ratio of income per unit to annual average nominal
value per unit
value per unit
Atlantic 1:
Atlantic 2:
Diversification by geographical area (%)
Diversification by geographical area (%)
Commercial
17
Other
15
Offices
Offices
83
85
Atlantic 1:
Atlantic 2:
Diversification by intended use (%)
Diversification by intended use (%)
Other
Piemonte/Emilia R.
Lombardia
6
5
Lombardia
68
45
Campania
Piemonte
12
11
Lazio
15
Lazio
38
54 DeA Capital - Report on Operations
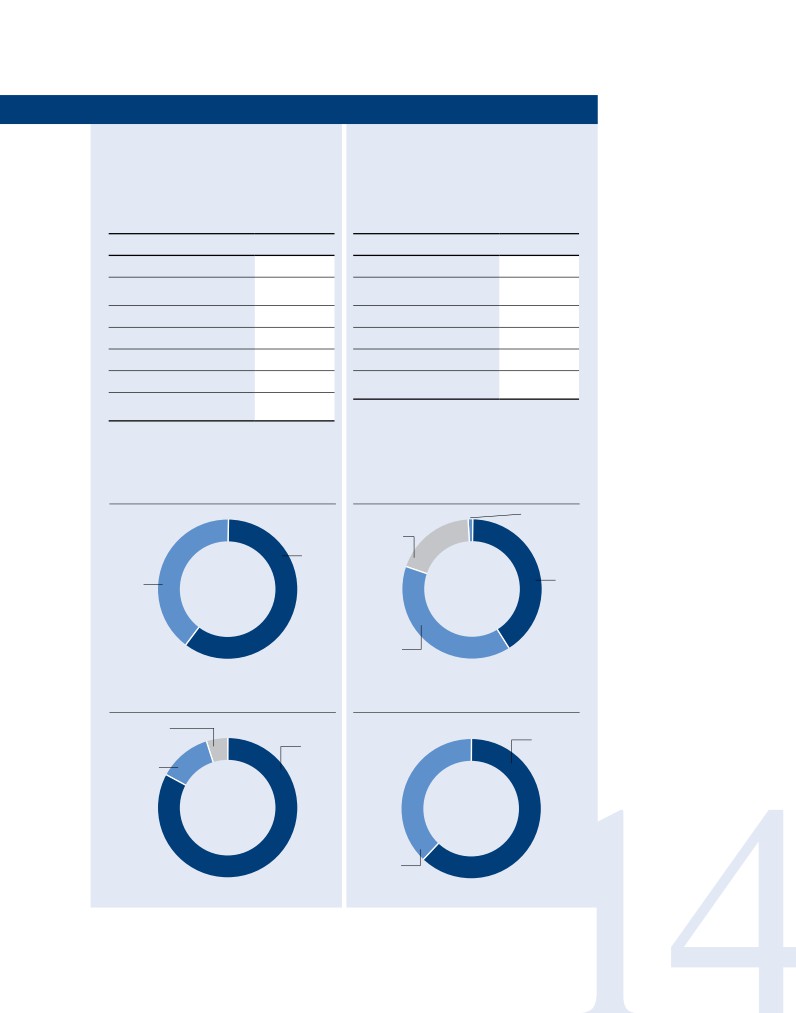
Alpha
31.12.2014
Beta
31.12.2014
Market value of properties
382,900,000
Market value of properties
95,785,000
Historical cost and
Historical cost and
capitalised charges
324,591,078
capitalised charges
99,875,020
Financing
51,834,695
Net Asset Value (NAV)
108,850,746
Net Asset Value (NAV)
371,760,134
NAV/unit (EUR)
405.4
NAV/unit (EUR)
3,578.9
Market price/unit (EUR)
276.0
Dividend yield from
Market price/unit (EUR)
1,129.0
investment*
8.40%
Dividend yield from
* Ratio of income per unit to annual average nominal
investment*
5.46%
value per unit
* Ratio of income per unit to annual average nominal
value per unit
Alpha:
Beta:
Diversification by geographical area (%)
Diversification by geographical area (%)
Commercial
Special
1
Use
19
Offices
60
Office
Other
41
40
Hotels
39
Alpha:
Beta:
Diversification by intended use (%)
Diversification by intended use (%)
Emila
Romagna
Lazio
Lazio
5
62
83
Lombardia
12
Umbria
38
DeA Capital - Annual Financial Statements to 31 December 2014
55
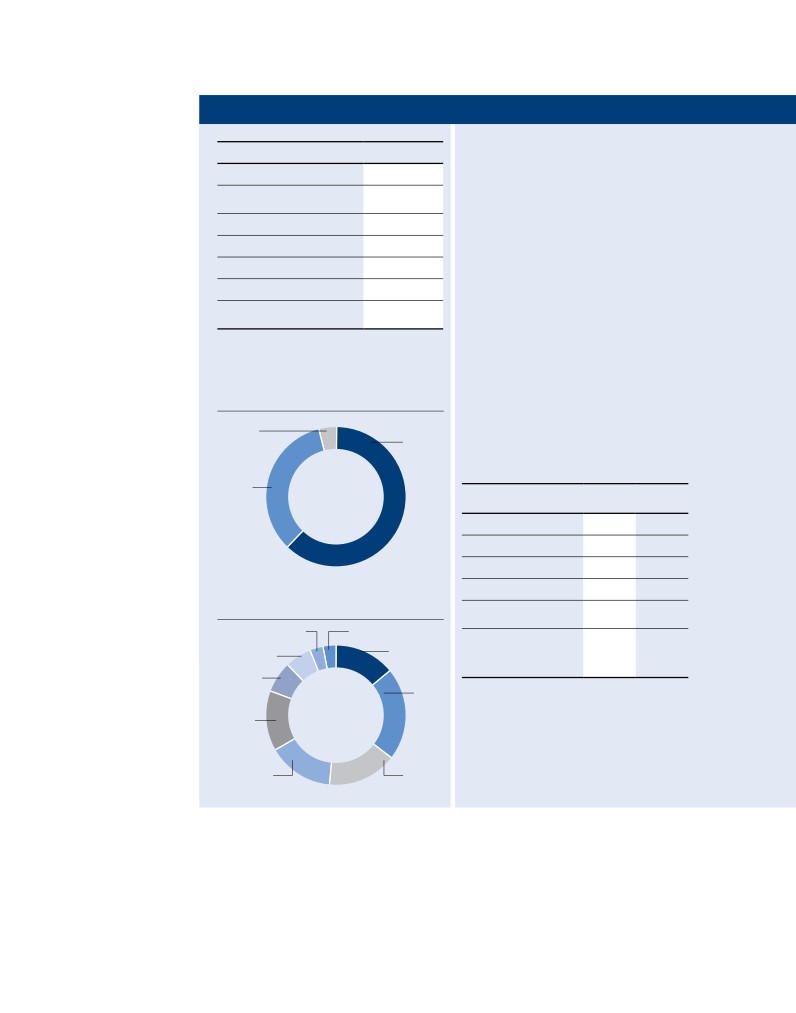
Delta
31.12.2014
With regard to IDeA FIMIT SGR's operating
performance, management fees in 2014 were
Market value of properties
210,860,000
EUR 10.5 million lower than in the same
Historical cost and capitalised
period of the previous year. This was mainly
charges
256,220,048
due to the revised fees agreed for some
Financing
25,102,155
managed funds, given the general market
squeeze on management fees and the need
Net Asset Value (NAV)
193,684,434
to stabilise investor relations.
NAV/unit (EUR)
92.0
Market price/unit (EUR)
42.3
The net result was also negatively affected
by the impairment of EUR 5.1 million
Dividend yield from
investment*
n.a.
(impairment of EUR 10.3 million in 2013)
on financial equity instruments (strumenti
* No distribution from investment
finanziari partecipativi, or SFP), which give
entitlement to variable commission relating
to the funds managed by FIMIT at the date
Delta:
of the merger with FARE SGR (the value
Diversification by geographical area (%)
is shown in the Financial Statements as
Offices
the effect of the merger of the two asset
4
Hotels
62
management companies).
Other
34
IDeA FIMIT SGR
(EUR million)
2014
2013
AUM
8,983
9,179
Management fees
54.1
64.6
Net profit/(loss)
4.4
1.2
-of which:
Delta:
Diversification by intended use (%)
- portion attributable
the shareholders
9.5
11.5
Piemonte
Toscana
3
3
- portion attributable
Sardegna
to holders of
Campania
14
financial equity
6
instruments
(5.1)
(10.3)
Lombardia
7
Veneto
21
Emila R.
14
Abruzzo
Calabria
15
16
56 DeA Capital - Report on Operations
INNOVATION REAL ESTATE
INVESTMENT DETAILS:
REGISTERED OFFICE:
Innovation Real Estate (IRE) operates in property
In terms of operating performance, IRE
Italy
valuation and is structured along the following
recorded strong revenue growth in 2014
strategic lines:
compared with 2013, mainly due to the
SECTOR:
increase in facility management, due
Property Services
• project & construction management (property
diligence and asset management services.
planning, development and reconditioning;
WEBSITE:
• property management (the administrative and
Innovation Real Estate
legal management of properties);
(EUR million)
2014
2013
• facility & building management (services
Revenues for real estate
connected with buildings and related
services
17.4
16.0
maintenance);
EBITDA
4.6
4.8
• due diligence (technical and environmental due
Net profit/(loss)
2.9
3.0
diligence, urban regulatory procedures);
• asset management (strategic support for
improving the rental condition of buildings
and optimising associated management costs,
in order to maximise the return on property
investment).
IRE currently manages a property portfolio
Specialized in
comprising 50% offices, with the remainder
split between commercial, tourist, logistics &
real estate services
industrial and residential property.
DeA Capital - Annual Financial Statements to 31 December 2014
57
Consolidated Income Statement
10.9 million to holding company activities. Alternative
Asset Management costs in 2014 include the effects of the
The Group reported a net loss of approximately EUR 57.6
amortisation of intangible assets recorded when a portion
million for 2014, compared with a net loss of around EUR
of the purchase price of the investments was allocated
31.1 million in 2013.
(totalling EUR 14.7 million, including EUR 4.9 million related
to impairment of the financial equity instruments of IDeA
Revenues and other income break down as follows:
FIMIT SGR).
- alternative asset management fees of EUR 66.0 million
Financial income and charges, which totalled EUR +2.9
(EUR 76.4 million in 2013);
million at 31 December 2014 (EUR -0.4 million in 2013),
- a contribution from investments valued at equity of EUR
mainly relate to income generated from cash and cash
-1.7 million (EUR +6.6 million in 2013);
equivalents, the return on the quasi-equity loan granted to
- other investment income, net of expenses, totalling EUR
the subsidiary Santé S.A. and other financial income.
-56.1 million (EUR -24.6 million in 2013), due to marking
the value of the shareholding in Santé to market (EUR
The full tax impact for 2014 (EUR +1.7 million, compared
-59.0 million), following the disposal of GDS;
with EUR -4.4 million in 2013) is the combined result of
- service revenues of EUR 18.7 million (a rise on the 2013
taxes of EUR 6.6 million due in respect of Alternative Asset
figure of EUR 16.3 million).
Management activities and tax credits of EUR 8.3 million
relating to holding activities.
Costs totalled EUR 88.0 million (EUR 129.5 million in 2013,
which included impairment on some of the goodwill of
Of the Group’s net loss of EUR 57.6 million, EUR -62.2 million
IDeA FIMIT SGR of EUR 43.7 million and the writedown on
was attributable to Private Equity Investment, EUR +9.3
intangible assets of EUR 27.5 million), of which EUR 71.2
million to Alternative Asset Management and EUR -4.7 million
million was attributable to Alternative Asset Management,
to holding company operations/eliminations.
EUR 5.9 million to Private Equity Investment and EUR
Summary Consolidated Income Statement
(EUR thousand)
Year 2014
Year 2013 (*)
Alternative Asset Management fees
66,045
76,356
Profit/(loss) from equity investments valued at equity
(1,673)
6,586
Other investment income/charges
(56,149)
(24,617)
Service revenues
18,667
16,329
Other revenues and income
509
4,032
Other costs and charges
(87,957)
(129,496)
Financial income and charges
2,905
(438)
PROFIT (LOSS) BEFORE TAXES
(57,653)
(51,248)
Income tax
1,720
(4,381)
PROFIT (LOSS) FOR THE YEAR FROM CONTINUING OPERATIONS
(55,933)
(55,629)
Profit/(loss) from assets held-for-sale/sold
0
0
PROFIT (LOSS) FOR THE YEAR
(55,933)
(55,629)
- Profit/(loss) attributable to the Group
(57,601)
(31,130)
- Profit/(loss) attributable to minorities
1,668
(24,499)
Earnings (loss) per share, base
(0.210)
(0.114)
Earnings (loss) per share, diluted
(0.210)
(0.114)
(*)
For more information about the effects of the retrospective application
of IFRS 10 see section IFRS 10 - Consolidated Financial Statements
58 DeA Capital - Report on Operations
Performance by business in 2014
Alternative
Holding
Private Equity
Asset
companies /
(EUR thousand)
Investment Management Eliminations Consolidated
Alternative Asset Management fees
0
68,549
(2,504)
66,045
Income from investments valued at equity
(1,149)
(524)
0
(1,673)
Other investment income/charges
(56,812)
663
0
(56,149)
Other revenues and income
146
18,357
673
19,176
Other costs and charges
(5,930)
(71,152)
(10,875)
(87,957)
Financial income and charges
3,006
155
(256)
2,905
PROFIT (LOSS) BEFORE TAXES
(60,739)
16,048
(12,962)
(57,653)
Income tax
0
(6,584)
8,304
1,720
PROFIT (LOSS) FOR THE YEAR FROM
CONTINUING OPERATIONS
(60,739)
9,464
(4,658)
(55,933)
Profit/(loss) from assets held-for-sale/sold
0
0
0
0
Profit/(loss) for the year
(60,739)
9,464
(4,658)
(55,933)
- Profit/(loss) attributable to the Group
(62,235)
9,292
(4,658)
(57,601)
- Profit/(loss) attributable to minorities
1,496
172
0
1,668
Performance by business in 2013
Alternative
Holding
Private Equity
Asset
companies /
(EUR thousand)
Investment Management Eliminations Consolidated
Alternative Asset Management fees
0
78,810
(2,454)
76,356
Income from investments valued at equity
6,940
(354)
0
6,586
Other investment income/charges
(23,264)
(1,353)
0
(24,617)
Other revenues and income
3,181
16,750
430
20,361
Other costs and charges
(4,797)
(121,962)
(2,737)
(129,496)
Financial income and charges
927
(190)
(1,175)
(438)
PROFIT (LOSS) BEFORE TAXES
(17,013)
(28,299)
(5,936)
(51,248)
Income tax
1,294
(9,213)
3,538
(4,381)
PROFIT (LOSS) FOR THE YEAR FROM
CONTINUING OPERATIONS
(15,719)
(37,512)
(2,398)
(55,629)
Profit/(loss) from assets held-for-sale/sold
0
0
0
0
Profit/(loss) for the year
(15,719)
(37,512)
(2,398)
(55,629)
- Profit/(loss) attributable to the Group
(10,389)
(18,343)
(2,398)
(31,130)
- Profit/(loss) attributable to minorities
(5,330)
(19,169)
0
(24,499)
DeA Capital - Annual Financial Statements to 31 December 2014
59

Comprehensive Income -
Statement of Performance - IAS 1
Comprehensive Income or the Statement of Performance
(EUR thousand)
2014
2013 (*)
(IAS 1), in which performance for the period attributable
Profit/(loss) for
to the Group is reported including results posted directly
the year (A)
(55,933)
(55,629)
to shareholders' equity, reflects a net positive balance of
Items that could be
approximately EUR 30.1 million (compared with a net negative
subsequently reclassified within
the profit (loss) for the period.
88,547
(55,333)
balance of EUR 94.3 million in 2013). This comprised:
Items that could be
subsequently reclassified within
• a net loss of EUR 57.6 million recorded on the Income
the profit (loss) for the period.
(320)
25
Statement;
Total other profits/(losses),
• profits posted directly to shareholders’ equity totalling
net of tax effect (B)
88,227
(55,308)
EUR 87.7 million.
Total comprehensive profit/
(loss) for the
period (A)+(B)
32,294
(110,937)
As regards the latter, the largest component was the increase
in fair value of Kenan Inv./Migros; in particular, the increase
Total comprehensive
profit/(loss) for the period
of EUR 76.7 million versus 31 December 2013 was due to the
(A)+(B):
rise in the value of Migros shares and the appreciation of the
- Attributable to the Group
30,089
(94,311)
Turkish lira against the euro.
- Attributable to minorities
2,205
(16,626)
The effect on the DeA Capital Group’s NAV of this change in
(*) For more information about the effects of the retrospective application of
the fair value of Migros was partially offset by the reduction
IFRS 10 see section IFRS 10 - Consolidated Financial Statements.
in estimated carried interest to be paid, based on the total
capital gain (EUR -11.4 million).
60 DeA Capital - Report on Operations
Consolidated Statement of Financial Position
Below is the Group’s Statement of Financial Position at 31 December 2014 compared with 31 December 2013.
31 December
31 December
(EUR thousand)
2014
2013 (*)
ASSETS
Non-current assets
Intangible and tangible assets
Goodwill
166,363
166,315
Intangible assets
63,348
78,463
Property, plant and equipment
3,908
4,855
Total intangible and tangible assets
233,619
249,633
Investments
Investments valued at equity
19,066
240,084
Investments held by Funds
111,014
114,225
- available-for-sale investments
71,209
78,261
- invest. in associates and JV valued at FV through P&L
39,805
35,964
Other available-for-sale companies
209,320
132,536
Available-for-sale funds
176,736
166,260
Other available-for-sale financial assets
306
330
Total Investments
516,442
653,434
Other non-current assets
Deferred tax assets
5,039
2,657
Loans and receivables
0
30,372
Tax receivables from parent companies
546
2,984
Other non-current assets
30,495
32,468
Total other non-current assets
36,080
68,481
Total non-current assets
786,141
971,548
Current assets
Trade receivables
29,039
21,078
Available-for-sale financial assets
5,080
5,464
Financial receivables
2,678
0
Tax receivables from parent companies
3,533
3,467
Other tax receivables
2,892
4,912
Other receivables
18,591
18,416
Cash and cash equivalents
55,583
26,396
Total current assets
117,396
79,733
Total current assets
117,396
79,733
Held-for-sale assets
0
1,285
TOTAL ASSETS
903,537
1,052,566
SHAREHOLDERS' EQUITY AND LIABILITIES
SHAREHOLDERS' EQUITY
Share capital
271,626
273,975
Share premium reserve
384,827
386,198
Legal reserve
61,322
61,322
Fair value reserve
116,415
28,725
Other reserves
(11,243)
(8,898)
Retained earnings (losses)
(111,833)
(80,703)
Profit(loss) for the year
(57,601)
(31,130)
Net equity Group
653,513
629,489
Minority interests
173,109
177,070
Shareholders' equity
826,622
806,559
LIABILITIES
Non-current liabilities
Deferred tax liabilities
19,696
19,537
Provisions for employee end-of-service benefits
4,618
3,529
Long term financial loans
5,201
150,198
Payables to staff
0
406
Other payables
11,397
0
Total non-current liabilities
40,912
173,670
Current liabilities
Trade payables
18,180
15,599
Current tax
8,122
6,833
Debiti per imposte correnti
2,012
6,956
Other tax payables
2,037
1,478
Other payables
5,292
2,054
Short-term financial loans
360
39,418
Total current liabilities
36,003
72,338
Held-for-sale liabilities
0
0
TOTAL SHAREHOLDERS' EQUITY AND LIABILITIES
903,537
1,052,567
(*)
For more information about the effects of retroactive application of
IFRS 10 see section IFRS 10 - Consolidated Financial Statements
DeA Capital - Annual Financial Statements to 31 December 2014
61
At 31 December 2014, Group shareholders’ equity was
approximately EUR 653.5 million, compared with EUR 629.5
million at 31 December 2013. The increase in 2014 of around
EUR 24.0 million in this item was due to the reasons set out in
the Statement of Performance - IAS 1 (EUR 30.1 million).
Consolidated Net Financial Position
At 31 December 2014, the consolidated Net Financial Position
was approximately EUR 57.8 million, as shown in the table
below, which provides a breakdown of assets and liabilities and
a comparison with the same figures at 31 December 2013.
Net financial position
(EUR million)
31.12.2014
31.12.2013
Change
Cash and cash equivalents
55.6
26.4
29.2
Available-for-sale financial assets
5.1
5.4
(0.3)
Financial receivables
2.7
30.4
(27.7)
Non-current financial liabilities
(5.2)
(150.2)
145.0
Current financial liabilities
(0.4)
(39.4)
39.0
TOTAL
57.8
(127.4)
185.2
The change in the Consolidated Net Financial Position in
meet the requirement relating to payment commitments
2014 was mainly due to the receipt of proceeds of EUR
already subscribed in funds, also taking into account the
164.1 million from the sale of GDS, net liquidity generated
amounts expected to be called up/distributed by these funds.
by investments in own private equity funds in the portfolio of
With regard to these residual commitments, the Company
EUR 11.0 million and operational cash flows generated by the
believes that the resources currently available, as well as
asset management platforms.
those that will be generated by its operating and financing
activities, will enable the DeA Capital Group to meet the
The Company believes that the cash and cash equivalents
financing required for its investment activity and to manage
and the other financial resources available are sufficient to
working capital and repay debts when they become due.
62 DeA Capital - Report on Operations
6. Results of the Parent
Company DeA Capital S.p.A.
The Parent Company DeA Capital S.p.A. operates as a
A summary of the Income Statement and Statement of
holding company that carries out activities of coordination,
Financial Position of DeA Capital S.p.A. for the year ended 31
development and strategic management of its subsidiaries,
December 2014 is shown below.
and also acts as an entity that makes financial investments
directly.
Income statement of the Parent Company
(Euro)
Year 2014
Year 2013
Other investment income/expense
(3,640,681)
(60,979,549)
Income from services
1,868,506
1,132,082
Other income
252,730
171,624
Personnel costs
(10,395,642)
(5,795,787)
Financial income
(269,622)
(1,128,767)
PROFIT/(LOSS) BEFORE TAX
(12,184,709)
(66,600,397)
Income tax
7,665,490
3,734,194
PROFIT/(LOSS) FOR THE YEAR FROM CONTINUING OPERATIONS
(4,519,219)
(62,866,203)
Profit (Loss) from discontinued operations/held-for-sale assets
0
0
PROFIT/(LOSS) FOR THE YEAR
(4,519,219)
(62,866,203)
The Parent Company recorded a net loss of EUR 4.5 million for
The loss for 2014 compares with a year-earlier loss of
2014, mainly due to writedowns on shareholdings, which were
approximately EUR 62.9 million, which was caused by the
partly offset by dividend flows and the positive tax impact.
writedown on subsidiary DeA Capital Investments as a result of
the impairment made in 2013 for Kenan Investments/Migros.
DeA Capital - Annual Financial Statements to 31 December 2014
63
Statement of Financial Position of the Parent Company
The Parent Company's Statement of Financial Position at 31 December 2014, compared with 31 December 2013, is shown below,
(Euro)
31.12.2014
31.12.2013
ASSETS
Non-current assets
Intangible and tangible assets
Intangible assets
13,609
7,183
Tangible assets
586,918
804,965
Total intangible and tangible assets
600,527
812,148
Investments
Subsidiaries and joint ventures
256,900,010
592,580,468
Associates
14,221,021
0
Available-for-sale investments
209,320,028
184,443
Available-for-sale funds
144,383,615
133,146,396
Total Investments
624,824,674
725,911,307
Other non-current assets
Deferred tax assets
0
0
Tax receivables from Parent companies
546,152
2,983,813
Total other non-current assets
546,152
2,983,813
Total non-current assets
625,971,353
729,707,268
Current assets
Trade receivables
557,069
646,711
Financial receivables
1,709,552
42,549,349
Tax receivables from Parent companies
2,782,826
3,106,824
Other tax receivables
115,044
558,488
Other tax receivables
289,382
778,432
Other receivables
538,818
524,323
Cash and cash equivalents
37,961,858
3,776,078
Total current assets
43,954,549
51,940,205
Total current assets
43,954,549
51,940,205
Held-for-sale assets
0
1,285,190
TOTAL ASSETS
669,925,902
782,932,663
SHAREHOLDERS' EQUITY AND LIABILITIES
SHAREHOLDERS' EQUITY
Share capital
271,626,364
273,975,096
Share premium reserve
384,826,924
386,197,724
Legal reserve
61,322,420
61,322,420
Fair Value reserve
12,908,007
(20,456,795)
Other reserves
504,126
462,873
Retained earnings (losses)
(71,451,400)
(8,585,197)
Profit/(loss) for the year
(4,519,219)
(62,866,203)
Shareholders' equity
655,217,222
630,049,918
LIABILITIES
Non-current liabilities
Deferred tax liabilities
0
0
Provisions for risks and charges
558,957
384,413
Long term financial loans
0
122,206,023
Other payables
11,396,404
0
Total non-current liabilities
11,955,361
122,590,436
Current liabilities
Trade payables
1,325,359
1,859,878
Payables to staff and social security organisations
828,943
859,470
Current tax payables
63,926
63,926
VAT payables vs Parent companies
339,690
0
Other tax payables
184,324
184,763
Other payables
11,077
975
Short term financial loans
0
27,323,297
Total current liabilities
2,753,319
30,292,309
Held-for-sale liabilities
0
0
TOTAL SHAREHOLDERS' EQUITY AND LIABILITIES
669,925,902
782,932,663
64 DeA Capital - Report on Operations
At 31 December 2014, the Parent Company's shareholders'
million (due to the increase in fair value, taken directly to
equity totalled about EUR 655,2 million compared with EUR
shareholders' equity, of portfolio investments),
630,0 million at 31 December 2013, an increase of EUR 25,2
Pursuant to the Consob Communication of 28 July 2006, a reconciliation between the loss and shareholders' equity at 31 December
2014 reported by the Parent Company DeA Capital S.p.A. is shown below together with the corresponding consolidated figures,
Shareholders’
Shareholders’
equity at
Net profit/
equity at
Net profit/
31 December
(loss) -
31 December
(loss) -
(EUR thousand)
2014
2014
2013
2013
Shareholders' equity and profit/(loss) for the year, as
reported in the financial statements of the Parent Company
655,217
(4,519)
630,050
(62,866)
Derecognition of carrying value of consolidated investments:
- Excess in shareholders' equity in the annual financial statements
in relation to the carrying values of equity investments in
consolidated companies
(1,704)
0
(561)
0
- Pro-rata profit/(loss) recorded by subsidiaries
0
(45,824)
0
(14,747)
- Derecognition of dividends received by the investee companies
of DeA Capital S.p.A.
(8,141)
(15,013)
- Pro-rata profit/(loss) recorded by associates valued at equity
0
(1,673)
0
1,861
- Derecognition of revaluations and write-downs of consolidated
equity investments operated by DeA Capital S.p.A.
0
193,033
0
194,102
- Derecognition of dividends received by DeA Capital S.p.A.
0
(190,477)
0
(134,468)
Group shareholders' equity and net profit (loss)
attributable to the Group
653,513
(57,601)
629,489
(31,130)
Shareholders’ equity and net profit (loss) attributable
to non-controlling interests
173,109
1,668
177,070
(24,499)
Shareholders' equity and net profit (loss) as reported
in the consolidated balance sheet
826,622
(55,933)
806,559
(55,629)
DeA Capital - Annual Financial Statements to 31 December 2014
65

7. Other information
in place from time to time, and the use of treasury shares
to service purchases of controlling interests in FARE Holding
and IDeA Alternative Investments, at 31 December 2014 the
Treasury shares and Parent
Company owned 34,985,736 treasury shares (equal to about
Company shares
11.4% of share capital).
On 17 April 2014, the shareholders’ meeting of DeA Capital
On 6 November 2014, the Board of Directors, voted to adhere
S.p.A. authorised the Board of Directors to buy and sell,
to the markets practice intended for the purchase of own
on one or more occasions, on a rotating basis, a maximum
shares to be used to create the securities “stock”, pursuant
number of ordinary shares in the Company representing a
Consob resolution 16839 of 19 march 2009.
stake of up to 20% of the share capital.
As of the date of this document, based on purchases of
The new plan replaces the previous plan approved by
2,383,540 shares made after the end of 2014, the Company
the shareholders’ meeting on 19 April 2013 (which was
had a total of 37,369,276 treasury shares corresponding to
scheduled to expire with the approval of the 2013 Annual
about 12.2% of the share capital.
Financial Statements), and will pursue the same objectives
as the previous plan, including purchasing treasury shares to
During 2014, the Company did not hold, purchase or sell, on
be used for extraordinary transactions and share incentive
its own account or through a trust company, any shares in the
schemes, offering shareholders a means of monetising their
Parent Company De Agostini S.p.A.
investment, stabilising the share price and regulating trading
within the limits of current legislation.
Stock option and performance
The authorisation specifies that purchases may be carried
share plans
out up to the date of the shareholders’ meeting to approve
the Financial Statements for the Year Ending 31 December
On 17 April 2014, the shareholders’ meeting of DeA Capital
2014, and in any case, not beyond the maximum duration
S.p.A. approved the DeA Capital Stock Option Plan 2014-2016.
allowed by law, in accordance with all the procedures allowed
To implement the resolution of the shareholders’ meeting,
by current regulations, and that DeA Capital S.p.A. may also
the Board of Directors voted (i) to launch the DeA Capital
sell the shares purchased for the purposes of trading, without
Stock Option Plan 2014-2016 approved by the shareholders’
time limits. The unit price for the purchase of the shares is set
meeting, vesting the Chairman of the Board of Directors and
on a case-by-case basis by the Company's Board of Directors,
the Chief Executive Officer with all necessary powers, to be
but in any case must not be more than 20% above or below
exercised jointly or severally and with full power of delegation;
the share’s reference price on the trading day prior to each
and (ii) to allocate a total of 1,550,000 options to certain
individual purchase. In contrast, the authorisation to sell
employees of the Company, its subsidiaries and of the Parent
treasury shares already held in the Company’s portfolio, and
Company De Agostini S.p.A. who carry out important roles for
any shares bought in the future, was granted for an unlimited
the Company.
period, to be implemented using the methods considered most
appropriate and at a price to be determined on a case-by-case
In line with the criteria specified in the regulations governing
basis by the Board of Directors, which must not, however,
the DeA Capital S.p.A. Stock Option Plan 2014-2016, the
be more than 20% below the share's reference price on the
Board of Directors also set the exercise price for the options
trading day prior to each individual sale (apart from in certain
allocated at EUR 1.32, which is the arithmetic mean of the
exceptional cases specified in the plan). Sale transactions may
official price of ordinary DeA Capital shares on the Mercato
also be carried out for trading purposes.
Telematico Azionario, the Italian screen-based trading system
organised and managed by Borsa Italiana S.p.A., on the
On the same date, the Board of Directors voted to launch
trading days between 17 March 2014 and 16 April 2014.
the plan to buy and sell treasury shares authorised by the
shareholders’ meeting, vesting the Chairman of the Board
The shareholders’ meeting of 17 April 2014 also approved a
of Directors and the Chief Executive Officer with all the
paid capital increase, in divisible form, without option rights,
necessary powers, to be exercised jointly or severally and
via the issue of a maximum of 2,000,000 ordinary shares to
with full power of delegation.
service the DeA Capital S.p.A. Stock Option Plan 2014-2016.
In 2014, DeA Capital S.p.A. purchased around 2,348,732
The shareholders’ meeting also approved the adoption of
million shares valued at about EUR 3.7 million (at an average
the Performance Share Plan 2014-2016, which provides for
price of approximately EUR 1.58 per share).
the allocation of a maximum of 500,000 units. On the same
date, to implement the shareholders’ resolution, the Board
Taking into account purchases made in previous years for plans
of Directors of DeA Capital S.p.A. voted (i) to launch the
66 DeA Capital - Report on Operations

DeA Capital Performance Share Plan 2014-2016 approved
This agreement, which is renewable annually, is priced
by the shareholders’ meeting, vesting the Chairman of the
at market rates and is intended to allow the Company to
Board of Directors and the Chief Executive Officer with all
maintain a streamlined organisational structure in keeping
the necessary powers, to be exercised severally and with full
with its development policy, while obtaining sufficient
power of delegation; and (ii) to allocate a total of 393,500
operational support.
units (representing the right to receive ordinary shares in the
At the same time, on 1 January 2013, DeA Capital S.p.A.
Company free of charge, under the terms and conditions of
signed an “Agreement to sub-let property for use other
the plan) to certain employees of the Company, its subsidiaries
than residential use” with the controlling shareholder,
and of the Parent Company De Agostini S.p.A. who carry out
De Agostini S.p.A. The agreement relates to parts of a
important roles for the Company.
building located at Via Brera, 21, Milan, comprising space
for office use, warehousing and car parking.
The shares allocated due to the vesting of units will be drawn
from the treasury shares already held by the Company so that
This agreement is renewable every six years after an
the allocation will not have a dilutive effect.
initial term of seven years.
The shareholders’ meeting also approved the Company’s
2) DeA Capital S.p.A., IDeA Capital Funds SGR and DeA
Remuneration Policy pursuant to art. 123-ter of the
Capital Real Estate have adopted the national tax
Consolidated Finance Law.
consolidation scheme of the De Agostini Group (the Group
headed by De Agostini S.p.A., formerly B&D Holding di
The terms and conditions of the Stock Option Plan 2014-2016
Marco Drago e C. S.a.p.a.). This option was exercised
and the Performance Share Plan 2014-2016 are described in
jointly by each company and De Agostini S.p.A. by signing
the Information Prospectus prepared in accordance with art.
the “Regulation for participation in the national tax
84-bis of Consob Resolution 11971 of 14 May 1999 (Issuer
consolidation scheme for companies in the De Agostini
Regulations), available to the public at the registered office of
Group” and notifying the tax authorities of this option
DeA Capital S.p.A. and on the Company’s website
pursuant to the procedures and terms and conditions
set out by law. The option is irrevocable unless the
Incentive Plans).
requirements for applying the scheme are not met.
The option is irrevocable for DeA Capital S.p.A. for the
Transactions with parent companies,
three-year period 2014-2016, for IDeA Capital Funds SGR
subsidiaries and related parties
for the three-year period 2012-2014 and for DeA Capital
Real Estate for the three-year period 2013-2015.
Transactions with related parties, including those with other
Group companies, were carried out in accordance with the
3) In order to enable the more efficient use of liquidity and
Procedure for Related Party Transactions adopted by the
the activation of credit lines with potentially better terms
Company with effect from 1 January 2011 in accordance
and conditions compared with those that may be obtained
with the provisions of the Regulation adopted pursuant to
from banks, DeA Capital S.p.A. has signed a framework
art. 2391-bis of the Italian Civil Code with Consob Resolution
agreement (Framework Agreement) with the Parent
17221 of 12 March 2010 as subsequently amended. During
Company De Agostini S.p.A. for the provision of short-
the year, the Company did not carry out any atypical or
term intercompany loans.
unusual transactions with related parties but only those
that are part of the normal business activities of Group
Deposit/financing operations falling within this Framework
companies. It also did not carry out any “significant
Agreement shall only be activated subject to verification
transactions” as defined in the aforementioned procedure.
that the terms and conditions determined at any time are
Transactions with related parties during the year were
advantageous, and will be provided on a revolving basis,
concluded under standard market conditions for the nature of
and with maturities of not more than three months.
the goods and/or services offered.
The Framework Agreement shall have a duration of one
year and is renewable.
With regard to transactions with parent companies, note the
following:
The amounts involved in the deposit/financing operations
will, however, be below the thresholds defined for
1) DeA Capital S.p.A. signed a service agreement with the
“transactions of lesser importance” pursuant to Consob
controlling shareholder, De Agostini S.p.A., for the latter
Regulation 17221/2010 (transactions with Related Parties)
to provide operating services in the administration,
and the internal procedure on Transactions with Related
finance, control, legal, corporate and tax areas.
Parties adopted by DeA Capital S.p.A.
DeA Capital - Annual Financial Statements to 31 December 2014
67

Equity interests, remuneration and
Atypical or unusual transactions and
stock options held by directors,
non-recurring significant events and
auditors, general managers
transactions
and managers with strategic
responsibilities
Pursuant to Consob Communication 6064293 of 28 July 2006,
in 2014 neither the Company nor the Group carried out any
Information regarding the equity interests held by directors,
atypical and/or unusual transactions or significant transactions
auditors, general managers and managers with strategic
that were not a part of its ordinary operations.
responsibilities is reported in the relevant sections of the
Annual and Consolidated Financial Statements.
Corporate Governance
The information on remuneration and stock options allocated
to directors, auditors, general managers and managers with
With regard to the corporate governance system of DeA
strategic responsibilities is provided in the related sections of
Capital S.p.A., adopted to bring the Company in line
the Annual and Consolidated Financial Statements and in the
with the principles of the Code of Conduct approved by
Remuneration Report pursuant to art. 123-ter of the TUF in
the “Committee for the Corporate Governance of Listed
accordance with art. 84-quater of the Issuer Regulation, which
Companies” (Code of Conduct), please see the document
is available to the public at the headquarters of DeA Capital
entitled “Report on Corporate Governance and Ownership
S.p.A. and on the Company's website www.deacapital.it.
Structure” (in the Corporate Governance section of the
Company's website). Below is a summary of the main
information governing DeA Capital S.p.A.'s corporate
Management and coordination
governance.
Since 30 January 2007, the Company has been controlled
Issuer profile
by De Agostini S.p.A., which, in accordance with art.
The Issuer's corporate governance structure is based on the
2497-sexies of the Italian Civil Code, carries out
traditional administration and control model, and hinges on
management and coordination activities in respect of the
the central role played by the Board of Directors, the proper
Company. Please see the notes to the Financial Statements
disclosure of management decisions, an effective internal
above for key figures from the latest approved Financial
control system, the appropriate regulation of potential
Statements of De Agostini S.p.A.
conflicts of interest, and on rigorous standards of conduct
for carrying out transactions with related parties.
Research and development activities
Extent of application of the Code of Conduct
DeA Capital S.p.A. adheres to the Code of Conduct. Please
Pursuant to art. 2428, para. 3 of the Italian Civil Code, the
see the “Report on Corporate Governance and Ownership
Company did not carry out any research and development
Structure” published on the Company’s website (Corporate
activity in 2014.
Governance section) for information on the degree of
application of the provisions contained in the Code of Conduct.
Corporate bodies
• Following the resignation of Stefania Boroli, effective from
12 March 2015, the Board of Directors consists of nine
members, seven of whom are non-executive directors,
and three of whom are independent directors. It plays
a key role in the corporate governance system of DeA
Capital S.p.A. In particular, it has the power and the duty
to manage the operations of the Issuer with the ultimate
and main goal of creating value.
Pursuant to the articles of association, the Board manages
the Company's business, and is invested with all the
administrative powers needed for this purpose, with the
exception of those powers reserved for the shareholders'
meeting, pursuant to legislation and the articles of
association. The Board of Directors has conferred on the
Chairman, Lorenzo Pellicioli, and the CEO, Paolo Ceretti, all
68 DeA Capital - Report on Operations
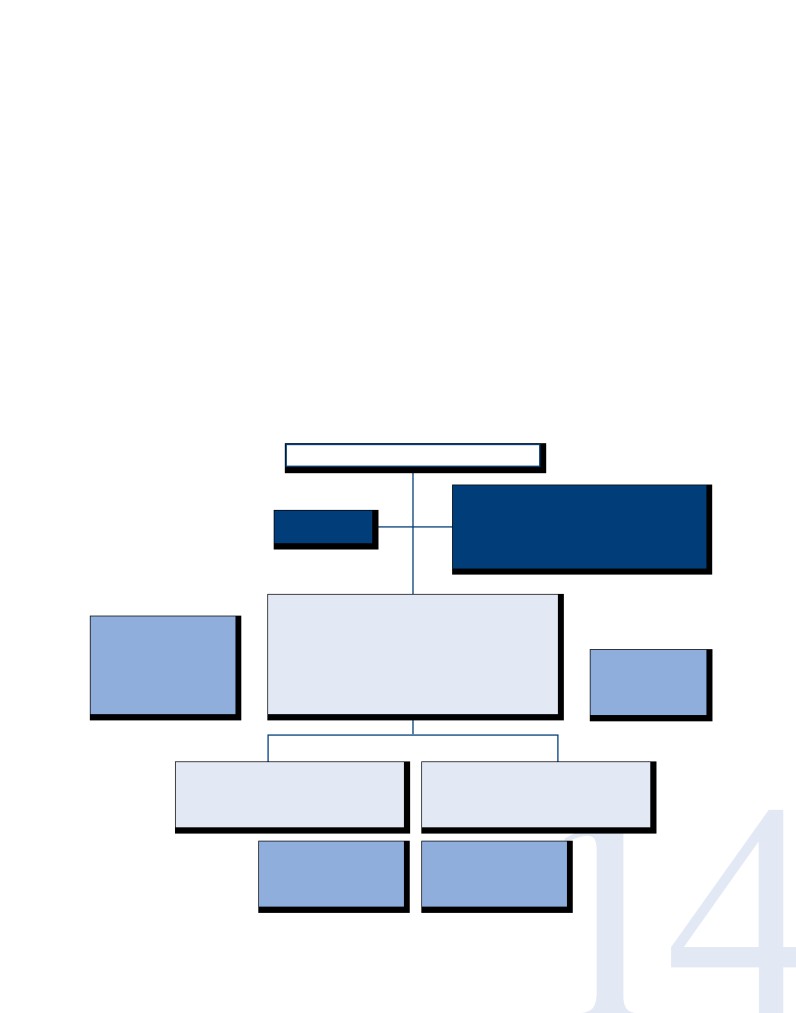
the powers of ordinary and extraordinary administration,
auditors). It monitors compliance with the law and the
with the authority to sign (i) with individual signature,
Company’s articles of association, observance of the
any deed, document or contract that involves an actual or
principles of proper management, and the suitability and
prospective expenditure commitment, or is connected with
proper functioning of the organisational, administrative
an investment of up to and including EUR 20,000,000; (ii)
and accounting structure. In 2014, the Board of Auditors
with joint signature, any deed, document or contract that
met 12 times.
involves an actual or prospective expenditure commitment
or is connected with an investment of between EUR
• The Remuneration Committee comprises three
20,000,000 and EUR 100,000,000. The Board of Directors,
independent directors. The Committee submits proposals
however, has the exclusive authority for any decision on
to the Board of Directors concerning the remuneration
expenditure commitments and investments of over EUR
of the chief executive officer, and assesses the chief
100,000,000.
executive officer’s recommendations regarding the
remuneration of managers with strategic responsibility.
In 2014, the Board of Directors met seven times.
In 2014, the Remuneration Committee met once.
For 2015, the calendar of scheduled meetings has been
published in both Italian and English (also available on the
• The Control and Risk Committee comprises three
independent directors. The Committee has a consultative
role and makes proposals to the Board of Directors.
• The Board of Auditors comprises six members (the
In 2014, the Control and Risk Committee met five times.
chairman, two permanent auditors and three deputy
Corporate Governance Chart as at 31 December 2014:
Shareholders' Meeting
Board of Statutory Auditors:
Chairman: ANGELO GAVIANI
Independent
Permanent Auditors: ANNALISA R. DONESANA
Auditors KPMG
GIAN PIERO BALDUCCI
Deputy Auditors: GIULIO GASLOLI,
ANNAMARIA ESPOSITO, MAURIZIO FERRERO
Board of Directors
Executive:
LORENZO PELLICIOLI (PRES.),
PAOLO CERETTI (AD)
SUPERVISORY BODY:
Non-
Chairman: GIAN PIERO
executive:
LINO BENASSI, MARCO BOROLI,
BALDUCCI (AUDITOR)
MARCO DRAGO, ROBERTO DRAGO,
Members: SEVERINO
STEFANIA BOROLI
Lead Independent
SALVEMINI (INDIP.),
Independent
ROSARIO BIFULCO,
Director:
DAVIDE BOSSI
Non-Executive
FRANCESCA GOLFETTO,
ROSARIO BIFULCO
(INTERNAL AUDIT)
Directors:
SEVERINO SALVEMINI
Remuneration Committee
Control and Risks Committee:
Chairman: ROSARIO BIFULCO (INDIP.)
Chairman: SEVERINO SALVEMINI (INDIP.)
Members: FRANCESCA GOLFETTO (INDIP.),
Members: ROSARIO BIFULCO (INDIP.),
SEVERINO SALVEMINI (INDIP.)
FRANCESCA GOLFETTO (INDIP.)
Manager responsible
for preparing
Internal Audit:
the accounting statements:
DAVIDE BOSSI
MANOLO SANTILLI (CFO)
DeA Capital - Annual Financial Statements to 31 December 2014
69

Main risks and uncertainties to which
A.3. Regulatory changes
the Parent Company and consolidated
Many Group companies conduct their operations in regulated
Group companies are exposed
sectors and markets. Any changes to or developments in the
legislative or regulatory framework that affect the costs and
As described in the Report on Operations, the DeA Capital
revenues structure of investee companies or the tax regime
Group operates through, and is structured as, two business
applied could have negative effects on the Group’s financial
areas, Private Equity Investment and Alternative Asset
results and necessitate changes in the Group’s strategy. To
Management.
combat this risk, the Group has established procedures to
constantly monitor sector regulation and any changes thereto,
The risks set out below take into account the features of the
in order to take advantage of business opportunities and
market and the operations of Parent Company DeA Capital
respond promptly to any changes in the prevailing legislation
S.p.A. and the companies included in the Group’s Consolidated
and regulations.
Financial Statements, the main findings of a risk assessment
carried out in 2014, as well as the periodic monitoring
A.4. Performance of the financial markets
conducted partly through the regulatory policies adopted by
The Company’s ability to meet its strategic and management
the Group.
objectives could depend on the performance of financial
markets. A negative trend in financial markets could have
The Group has adopted a modern corporate governance
an effect on the Private Equity Investment sector in general,
system that provides effective management of the
making investment and divestment transactions more
complexities of its operations, and enables both individual
complex, and on the Group’s capacity to increase the NAV
companies and the Group to achieve their strategic objectives.
of investments in particular. The value of shareholdings held
Furthermore, the assessments conducted by the organisational
directly or indirectly through funds in which the Company
units and the directors confirm both the non-critical nature of
has invested could be affected by factors such as comparable
these risks and uncertainties and the financial solidity of the
transactions concluded on the market, sector multiples
DeA Capital Group.
and market volatility. These factors that cannot be directly
controlled by the Group are constantly monitored in order
With reference to the specific risks relating to the main Private
to identify appropriate response strategies that involve both
Equity investment, i.e. Migros, please see said company's
the provision of guidance for the management of Group
Annual Report (available on the Migros website).
companies, and the investment and value enhancement
strategy for the assets held.
A. Contextual risks
A.5. Exchange rates
A.1. Risks relating to general economic
Holding investments in currencies other than the euro exposes
conditions
the Group to changes in exchange rates between currencies.
The operating performance and financial position of the DeA
The investment in Kenan Investments is managed as a special
Capital Group are affected by the various factors that make up
case, since although it was made in euros, the underlying
the macro-economic environment in the countries in which the
asset is expressed in Turkish lira. Taking into account the time
Group has invested, including GDP performance, investor and
horizon of the investment, it is believed that the expected
consumer confidence, interest rates, inflation, the costs of raw
return on the investment can absorb any devaluation of the
materials and unemployment.
underlying currency, if this is in line with the outlook for the
The ability to meet medium- to long-term objectives could be
currency.
affected by general economic performance, which could slow
the development of sectors the Group has invested in, and at
A.6. Interest rates
the same time, the business of the investee companies.
Financing operations that are subject to variable interest rates
could expose the Group to an increase in related financial
A.2. Socio-political events
charges, in the event that the reference interest rates rise
In line with its own strategic growth guidelines, one of the
significantly.
DeA Capital Group’s activities is private equity investment in
companies and funds in different jurisdictions and countries
around the world, which, in turn, invest in a number of
countries and geographical areas. The DeA Capital Group may
have invested in foreign countries whose social, political and
economic conditions put the achievement of its investment
objectives at risk.
70 DeA Capital - Report on Operations

B. Strategic risks
on the funds' financial results and the valuation of the
B.1. The Private Equity Investment strategy
property managed;
adopted by the Group includes:
- concentration of the maturities of numerous real estate
The Private Equity Investment strategy adopted by the Group
funds within a narrow timeframe, with related high
includes:
availability of property on the market, leading to a decrease
in property values and an increase in selling times.
- Direct investments;
- Indirect investments (via funds).
For each of the risk scenarios outlined above, the Group has
defined and implemented appropriate strategies that include
Within this strategy, the Group’s overall profitability could be
strategic, operational and management aspects, as well as a
adversely affected by an unfavourable trend in one or a few
system monitoring the level of diversification of Alternative
investments, if there were insufficient risk diversification,
Asset Management activities.
resulting from the excessive concentration of investment in
a small number of assets, sectors, countries, currencies or of
B.3. Key resources (governance/organisation)
indirect investments in funds with limited investment targets/
The success of the DeA Capital Group depends to a large extent
types of investment.
on its executive directors and certain key management figures,
their ability to efficiently manage the business and the ordinary
To combat these risk scenarios, the Group pursues an asset
operations of the Group, as well as knowledge of the market and
allocation strategy intended to create a balanced portfolio
the professional relationships established. The departure of one
with a moderate risk profile, investing in sectors and in
or more of these key resources, without a suitable replacement
companies with an appealing current and future risk/return
being found, as well as an inability to attract and retain new
ratio. Furthermore, the combination of direct and indirect
and qualified resources, could impact growth targets and have
investments, which by their nature guarantee a high level of
a negative effect on the Group’s operating performance and
diversification, helps reduce the level of asset concentration.
financial results. To mitigate this risk, the Group has put in
place HR management policies that correspond closely to the
needs of the business, and incentive policies that are periodically
B.2. Concentration of Alternative Asset
reviewed, in light of, among other things, the general economic
Management activities
climate and the results achieved by the Group.
In the Alternative Asset Management business, events could
arise as a result of excessive concentration that would hinder
C. Operating risks
the achievement of the level of expected returns. These
C.1 Investment operations
events could be due to:
Investment operations conducted by the Group are subject
to the risks typical of private equity activities, such as the
• Private equity funds
accurate valuation of the target company and the nature of
- concentration of the management activities of asset
the transactions carried out. The Group has implemented a
management companies across a limited number of funds,
structured process of due diligence on target companies and
in the event that a decision is made in respect of one or
the careful definition of the shareholders’ agreements in order
more funds to cancel the associated asset management
to conclude agreements in line with the investment strategy
mandate;
and the risk profile defined by the Group.
- concentration of the financial resources of the funds
managed in a limited number of sectors and/or
C.2. Compliance with covenants
geographical areas, in the event of currency, systemic or
Some investment operations were concluded using financial
sector crises;
leverage to invest in the target companies. For financing
- for closed funds, the concentration of the commitment
contracts signed by investee companies, specific covenants
across just a few subscribers.
generally backed by collateral are in place; failure to comply
with these could require investee companies to carry out
• Real estate funds
recapitalisation operations and lead to an increase in financial
- concentration of real estate present in the portfolio of
charges associated with debt refinancing. Failure to comply
managed funds in a few cities and/or in limited types of
with covenants attached to loans could have negative effects
property (management/commercial), in the event of a
on both the financial situation and operations of investee
crisis in the property market concerned;
companies, and on the value of the investment.
- concentration in respect of certain major tenants, in the
The Group constantly monitors the significant reference
event that these withdraw from the rental contracts, which
parameters for the financial obligations taken on by investee
could lead to a vacancy rate that has a negative impact
companies, in order to identify any unexpected variance in
good time.
DeA Capital - Annual Financial Statements to 31 December 2014
71

C.3. Divestment operations
C.4. Funding Risk
In its Private Equity Investment business, the Group generally
The income flows expected from the Alternative Asset
invests over a medium-/long-term time horizon. Over the
Management business depend on the capacity of the Group’s
investment management period, external situations could
asset management companies to stabilise/grow their assets
arise that might have a significant impact on the operating
under management. In this environment, fundraising
results of the investee companies, and consequently on the
activity could be harmed by both external factors, such as
value of the investment itself. Furthermore, in the case of co-
the continuation of the global economic crisis or the trend
investment, guiding the management of an investee company
in interest rates, and internal factors, such as bad timing in
could prove problematic or infeasible, and it may ultimately
respect of fund raising activities by the asset management
prove impossible to dispose of the stakes held owing to
companies or the departure of key managers from the
lock-up clauses. The divestment strategy could therefore be
companies. The Group has established appropriate risk
negatively affected by various factors, some of which cannot
management strategies in relation to fundraising, with a
be foreseen at the time the investments are made. There is
view to both involving new investors and retaining current
therefore no guarantee that expected earnings will be realised
investors.
given the risks resulting from the investments made.
To combat these risk situations, the Group has defined a
process to monitor the performance of its investee companies,
facilitated by its representation on the management bodies of
significant investee companies, with a view to identifying any
critical situations in good time.
72 DeA Capital - Report on Operations

Other information
At 31 December 2014, the Group had 224 employees (208
at the end of 2013, including 38 senior managers, 65 middle
managers and 121 clerical staff. 211 of these worked in
Alternative Asset Management and 13 in Private Equity
Investment/the Holding Company. These staff levels do not
include personnel on secondment from the Parent Company
De Agostini S.p.A.
With regard to the regulatory requirements set out in art. 36
of the Market Regulation on conditions for the listing of parent
companies of companies formed or regulated by laws of non-
EU countries and of major importance in the consolidated
accounts, it is hereby noted that no Group company falls
within the scope of the above-mentioned provision.
Furthermore, conditions prohibiting listing pursuant to art. 37
of the Market Regulation relating to companies subject to the
management and coordination of other parties do not apply.
DeA Capital - Annual Financial Statements to 31 December 2014
73

The Management
Lorenzo Pellicioli, Executive Chairman
Lorenzo Pellicioli (64 years old) is Chairman of the Board
of Directors of DeA Capital.
He started his career as a journalist for the newspaper
Giornale Di Bergamo and afterwards became Vice-
President of Bergamo TV Programmes.
Paolo Ceretti, Chief Executive Officer
From 1978 to 1984 he held different posts in Italian
private television sector: for Manzoni Pubblicità, for
Paolo Ceretti (60 years old) is Chief Executive Officer
Publikompass up to his nomination as Rete 4 General
of DeA Capital since 2007.
Manager.
He gained his professional experience inside the Agnelli
In 1984 he joined Gruppo Mondadori, the leading Italian
Group, holding from 1979 positions of increasing
publishing group. He was initially appointed General
importance at Fiat SpA (Internal Auditing and Finance)
Manager for Advertising Sales, and Mondadori Periodici
and in the Financial Services Sector (Planning, Credit
(magazines) Deputy General Manager, and afterwards
and Control) and subsequently assuming the position
President and CEO of Manzoni & C. S.p.A, the Group’s
of Head of Strategic Planning and Development of Ifil
advertising representative.
(now EXOR).
From 1990 to 1997, he served first as President and CEO
After assuming responsibility for the internet B2C
of Costa Cruise Lines in Miami, which is part of the Costa
sector of Fiat/Ifil in 1999 as CEO of CiaoHolding and
Crociere Group operating in the North American market
CiaoWeb, he was appointed CEO of GlobalValue SpA,
(USA, Canada and Mexico) and then became General
at Fiat/IBM joint venture in the Information Technology
Manager of Costa Crociere S.p.A., based in Genoa.
sector.
From 1995 to 1997 he was also President and CEO of
Since 2004, he has been General Manager of De
Compagnie Française de Croisières (Costa-Paquet), the
Agostini S.p.A., the holding of the De Agostini Group
Paris-based subsidiary of Costa Crociere.
where he is also CEO of De Agostini Editore.
From 1997 onwards he participated in the privatisation of
He is a member of the Board of Directors of GTECH,
SEAT Pagine Gialle, which was purchased by a group of
Zodiak Media, IDeA FIMIT and other companies of the
financial investors. After the acquisition he was appointed
Group.
CEO of SEAT.
In February 2000 he also took charge of the Internet
Business unit of Telecom Italia, subsequent to the sale of
SEAT.
In September 2001, following the acquisition of Telecom
Italia by the Pirelli Group, he resigned.
As from November 2005 he became CEO of the De
Agostini Group.
He is Chairman of GTECH, Chairman of Zodiak Media
and member of the Board of Directors of Assicurazioni
Generali S.p.A..
He is also member of the Advisory Boards of Investitori
Associati IV, Wisequity II, Macchine Italia and Palamon
Capital Partners. Since 2006 he has been a member of
For further info:
the Global Clinton Initiative.
section: About Us
74 DeA Capital - Report on Operations

Manolo Santilli, Chief Financial Officer
Manolo Santilli (46 years old) is Chief Financial Officer
of DeA Capital since February 2007.
He gained his professional experience starting in 1996
in STET International in the Planning, Controlling and
Initiative Evaluation area, subsequently assuming in
2000 the responsibility of Administration and Control
at IFIL/FIAT of the Internet Start-up Ciaoweb.
In 2002 he became Investment Manager in
Finmeccanica and since 2004 he entered the
De Agostini Group where he is currently also
Administration, Finance and Reporting Manager for
De Agostini S.p.A..
In 1994 he graduated in Economics at the Università
Paolo Perrella, Investor Relations Director
Commerciale L. Bocconi of Milan. He is also Auditor
and member of the Professional Accountants register
Paolo Perrella (49 years old) joined DeA Capital at
in Pescara.
the end of 2007 to manage relations with institutional
investors and analysts. He is also Investor Relations
Director at De Agostini SpA, where he is responsible
for monitoring and control of some large financial
investments.
Carlo Frau, Head of strategy and development
He previously worked 10 years as equity analyst:
Carlo Frau (59 years old), since 2010, he reports
member of the ABN AMRO telecoms pan-European
directly to the Chief Executive Officer and supports
team and, at the beginning of his career, at the finance
the top management of DeA Capital in the selection,
department of RAS (Allianz Group).
disposal and management of strategic investments,
He also spent 2 years at Interbanca, an Italian
where he
merchant bank, as Senior Manager, Equity Capital
currently follows IDeA Fimit and Migros Ticaret.
Marklets.
Since April 2014 he is also CEO of Innovation Real
From 2003 to 2007 worked for Telecom Italia, firstly as
Estate S.p.A..
VP, Investor relations, then as VP of Strategic
He graduated in Economics at Università L. Bocconi
Planning, a function reporting to the CEO.
in Milan in 1978 and began his career auditing with
BA in Business Administration with full marks in 1990
KPMG in Germany, USA and France (1978-81), he then
at Università Bocconi, in Milan. He earned the
began investment banking with Banque Sudaméris in
CFA® designation in 2002.
Paris (1981-84)where he was internal auditor, credits
director and assistant to the Chairman. He then
managed the M&A activity initially at Citicorp in London
(1984-89) and then at Chase Manhattan in Italy
and Switzerland (1989-94). Subsequently he began
strategic consulting with Gemini Consulting (1994-99).
He then moved to the Montedison Group where he was
in charge of the Group Strategy and Control (1999),
following which he became Chairman and CEO of
Antibiotics (1999-2003), where he was responsible
for restructuring the company, he then became
assistant to the chairman following the disposal of
Antibiotics in 2003. He was appointed Crisis Manager
For further info:
in the restructuring of the Parmalat Group , following
section: About Us
the crack. Finally, until 2009, he became Executive
Director of Management & Capitali and CEO of Cuki-
Domopak.
DeA Capital - Annual Financial Statements to 31 December 2014
75

Significant events after the end
8. Proposal to approve the
of 2014 and outlook
Financial Statements of DeA
Capital S.p.A. for the Year
Significant events after the end of 2014
Ending 31 December 2014
After the end of 2014, the DeA Capital Group increased its
and the partial distribution
investment in the IDeA I FoF, ICF II, ICF III, IDeA OF I, IDeA
of the share premium reserve
EESS and AVA funds following total payments of EUR 9.2
million (EUR 5.2 million, EUR 1.5 million, EUR 0.1 million, EUR
0.3 million, EUR 1.3 million and EUR 0.8 million respectively).
Dear shareholders,
At the same time, the DeA Capital Group received capital
reimbursements totalling EUR 15.2 million from the IDeA I FoF
In submitting the Annual Financial Statements for the financial
(EUR 13.6 million) and ICF II (EUR 1.6 million) funds to be
year ended 31 December 2014 for your approval, the Board of
used in full to reduce the carrying value of the units.
Directors proposes that you pass the following resolutions:
Outlook
“The DeA Capital S.p.A. ordinary shareholders’ meeting,
The outlook continues to focus on the strategic guidelines
followed last year, with an emphasis on increasing the value of
- after reviewing the draft Annual Financial Statements for the
assets in the Private Equity Investment area and developing
Year Ending 31 December 2014, which show a loss of EUR
Alternative Asset Management platforms.
4,519,219 (loss of EUR 62,866,203 in 2013);
- in acknowledgement of the Reports of the Board of Auditors
With regard to the Private Equity Investment area, having
and of the independent auditors, KPMG S.p.A.;
completed the sale of the stake in Générale de Santé, the
- in acknowledgement that the legal reserve is one-fifth of the
Company will continue its efforts to increase the value of the
share capital and that the share premium reserve of DeA
investments in its portfolio. In particular, the partial disposal
Capital S.p.A. at 31 December 2014 was EUR 384,826,924
of the stake in Kenan Investments/Migros is scheduled
(equivalent to EUR 414.192.866 gross of the amount
for completion before the end of the first half of 2015, in
attributable to treasury shares purchased and the costs of
accordance with the agreements signed at the end of 2014.
the capital increase in 2007);
Turning to Alternative Asset Management, as referred to
resolves
above, the Company will continue to develop platforms for
both private equity (through IDeA Capital Funds SGR) and
1. to approve the Report of the Board of Directors on the
real estate (through IDeA FIMIT SGR), as well as associated
Group's position and on operating performance;
real estate activities (i.e. project, property and facility
2. to approve the Statement of Financial Position, Income
management and property brokerage via IRE/IRE Advisory).
Statement and Notes to the Annual Financial Statements
for the Year Ending 31 December 2014 and the related
In order to support the strategic guidelines above, the
annexes;
Company will continue to maintain a solid asset/financial
3. to carry forward the loss of EUR 4,519,219 reported in
base, optimised by returning profits to shareholders (including
the Annual Financial Statements for the Year Ending 31
through buy-back operations), based on the available liquidity.
December 2014;
4. to make a partial distribution of the share premium reserve
in an amount of EUR 0.30 per share;
5. to grant Chairman Lorenzo Pellicioli and Chief Executive
Officer Paolo Ceretti broad powers to execute these
resolutions, jointly or severally through their agents and in
compliance with the deadlines and procedures established
by law.
Milan, 12 March 2015
FOR THE BOARD OF DIRECTORS
The Chairman
Lorenzo Pellicioli
76 DeA Capital - Report on Operations

Consolidated Financial
Statements for the Year
Ending 31 December 2014
• Consolidated statement
of financial position
• Consolidated income statement
• Consolidated statement
of comprehensive income
• Consolidated cash flow statement
• Statement of changes in consolidated
shareholders’ equity
• Notes to the accounts
DeA Capital - Annual Financial Statements to 31 December 2014
77
Consolidated statement of financial position
31 December
31 December
(EUR thousand)
Note
2014
2013 (*)
ASSETS
Non-current assets
Intangible and tangible assets
Goodwill
1a
166,363
166,315
Intangible assets
1b
63,348
78,463
Property, plant and equipment
1c
3,908
4,855
Total intangible and tangible assets
233,619
249,633
Investments
Investments valued at equity
2a
19,066
240,084
Investments held by Funds
2b
111,014
114,225
- available-for-sale investments
71,209
78,261
- invest. in associates and JV valued at FV through P&L
39,805
35,964
Other available-for-sale companies
2c
209,320
132,536
Available-for-sale funds
2d
176,736
166,260
Other available-for-sale financial assets
2e
306
330
Total Investments
516,442
653,434
Other non-current assets
Deferred tax assets
3a
5,039
2,657
Loans and receivables
0
30,372
Tax receivables from parent companies
3b
546
2,984
Other non-current assets
3c
30,495
32,468
Total other non-current assets
36,080
68,481
Total non-current assets
786,141
971,548
Current assets
Trade receivables
4a
29,039
21,078
Available-for-sale financial assets
4b
5,080
5,464
Financial receivables
4c
2,678
0
Tax receivables from parent companies
4d
3,533
3,467
Other tax receivables
4e
2,892
4,912
Other receivables
4f
18,591
18,416
Cash and cash equivalents
4g
55,583
26,396
Total current assets
117,396
79,733
Total current assets
117,396
79,733
Held-for-sale assets
0
1,285
TOTAL ASSETS
903,537
1,052,566
SHAREHOLDERS' EQUITY AND LIABILITIES
SHAREHOLDERS' EQUITY
Share capital
5a
271,626
273,975
Share premium reserve
5b
384,827
386,198
Legal reserve
5c
61,322
61,322
Fair value reserve
5d
116,415
28,725
Other reserves
5e
(11,243)
(8,898)
Retained earnings (losses)
5f
(111,833)
(80,703)
Profit(loss) for the year
5g
(57,601)
(31,130)
Net equity Group
653,513
629,489
Minority interests
5h
173,109
177,070
Shareholders' equity
826,622
806,559
LIABILITIES
Non-current liabilities
Deferred tax liabilities
3a
19,696
19,537
Provisions for employee end-of-service benefits
6a
4,618
3,529
Long term financial loans
6b
5,201
150,198
Payables to staff
0
406
Other payables
6c
11,397
0
Total non-current liabilities
40,912
173,670
Current liabilities
Trade payables
7a
18,180
15,599
Payables to staff and social security institutions
7b
8,122
6,833
Current tax
7c
2,012
6,956
Other tax payables
7d
2,037
1,478
Other payables
7e
5,292
2,054
Short-term financial loans
7f
360
39,418
Total current liabilities
36,003
72,338
Held-for-sale liabilities
0
0
TOTAL SHAREHOLDERS' EQUITY AND LIABILITIES
903,537
1,052,567
(*)
For more information about the effects of retroactive application of
IFRS 10 see section IFRS 10 - Consolidated Financial Statements
Pursuant to Consob Resolution 15519 of 27 July 2006, the impact of dealings with related parties on the Statement of Financial
Position, Income Statement and Cash Flow Statement is explained in the notes to the Financial Statements.
78 DeA Capital - Annual Financial Statements to 31 December 2014
Consolidated income statement
(EUR thousand)
Notes
Year 2014
Year 2013 (*)
Alternative asset management fees
8
66,045
76,356
Income from equity investments
9
(1,673)
6,586
Other investment income/expense
10
(56,149)
(24,617)
Income from services
11
18,667
16,329
Other income
12
509
4,032
Personnel costs
13a
(33,579)
(28,241)
Service costs
13b
(30,734)
(22,897)
Depreciation, amortisation and impairment
13c
(16,723)
(73,284)
Other expenses
13d
(6,921)
(5,074)
Financial income
14a
7,313
5,992
Financial expenses
14b
(4,408)
(6,430)
PROFIT/(LOSS) BEFORE TAX
(57,653)
(51,248)
Income tax
15
1,720
(4,381)
PROFIT/(LOSS) FOR THE PERIOD FROM CONTINUING
OPERATIONS
(55,933)
(55,629)
Profit (Loss) from discontinued operations/held-for-sale assets
0
0
PROFIT/(LOSS) FOR THE PERIOD
(55,933)
(55,629)
- Group share
(57,601)
(31,130)
- Non-controlling interests
1,668
(24,499)
Earnings per share, basic (EUR)
16
(0.210)
(0.114)
Earnings per share, diluted (EUR)
16
(0.210)
(0.114)
(*)
For more information about the effects of retroactive application of
IFRS 10 see section IFRS 10 - Consolidated Financial Statements
Pursuant to Consob Resolution 15519 of 27 July 2006, the impact of dealings with related parties on the Statement of Financial
Position, Income Statement and Cash Flow Statement is explained in the notes to the Financial Statements.
DeA Capital - Annual Financial Statements to 31 December 2014
79
Consolidated statement of comprehensive income
(Statement of Performance - IAS 1)
Comprehensive Income or the Statement of Performance (IAS 1), in which performance for the period attributable to the Group
is reported including results posted directly to shareholders' equity, reflects a net positive balance of approximately EUR 30.1
million (compared with a net negative balance of EUR 94.3 million in 2013). This comprised:
• a net loss of EUR 57.6 million recorded on the Income Statement;
• profits posted directly to shareholders’ equity totalling EUR 87.7 million.
As
regards the latter, the largest component was the increase in fair
value of Kenan Inv./Migros; in particular, the increase of EUR
76.7 million versus 31 December 2013 was due to the rise in the value of Migros shares and the appreciation of the Turkish lira
against the euro.
The effect on the DeA Capital Group’s NAV of this change in the fair value of Migros was partially offset by the reduction in
estimated carried interest to be paid, based on the total capital gain (EUR -11.4 million).
(EUR thousand)
Year 2014
Year 2013 (*)
Profit/(loss) for the year (A)
(55,933)
(55,629)
Items that could be subsequently reclassified within the profit (loss) for the
period.
88,547
(55,333)
Gains (losses) from the revaluation of available-for-sale financial assets
86,665
(64,217)
Other changes to the revaluation reserves of associates
1,882
8,884
Items that could be subsequently reclassified within the profit (loss)
for the period.
(320)
25
Gains/(losses) on remeasurement of defined benefit plans
(320)
25
Total Other profits/(losses), net of tax effect (B)
88,227
(55,308)
Total comprehensive profit/(loss) for the period (A)+(B)
32,294
(110,937)
Total comprehensive profit/(loss) for the period (A)+(B):
- Attributable to the Group
30,089
(94,311)
- Attributable to minorities
2,205
(16,626)
(*)
For more information about the effects of the retrospective application
of IFRS 10 see section IFRS 10 - Consolidated Financial Statements
80 DeA Capital - Annual Financial Statements to 31 December 2014
Consolidated cash flow statement (direct method)
Financial year
Financial year
(EUR thousand)
2014
2013 (*)
CASH FLOW from operating activities
Investments in funds and shareholdings
(26,023)
(39,829)
Acquisitions of subsidiaries net of cash acquired
0
(50,688)
Capital reimbursements from funds
29,030
25,332
Proceeds from the sale of investments
171,844
81
Interest received
292
531
Interest paid
(3,871)
(3,439)
Cash distribution from investments
6,846
5,820
Realized gains (losses) on exchange rate derivatives
5
(831)
Taxes paid
(14,911)
(14,828)
Dividends received
64
0
Management and performance fees received
57,658
68,717
Revenues for services
24,537
19,636
Operating expenses
(57,052)
(60,167)
Net cash flow from operating activities
188,419
(49,665)
CASH FLOW from investment activities
Acquisition of intangible fixed assets
(534)
(4,343)
Proceeds from sale of intangible fixed assets
14
756
Purchase of licences
(956)
(932)
Net cash flow from investment activities
(1,476)
(4,519)
CASH FLOW from financial activities
Acquisition of financial assets
(1,096)
(2,403)
Sale of financial assets
1,535
4,824
Share capital issued
3,214
8,586
Share capital issued:stock option plan
0
0
Own shares acquired
(3,720)
(885)
Own shares sold
0
0
Interest from financial assets
0
0
Dividends paid
(9,165)
(5,643)
Warrants
0
0
Managers Loan
0
0
Loan
(27,537)
(169)
Quasi-equity loan
32,756
0
Bank loan paid back
(153,743)
(1,035)
Bank loan received
0
47,000
Net cash flow from financial assets
(157,756)
50,275
CHANGE IN CASH AND CASH EQUIVALENTS
29,187
(3,909)
CASH AND CASH EQUIVALENTS AT BEGINNING OF PERIOD
26,396
30,305
Cash and cash equivalents relating to held-for-sale assets
0
0
Initial cash and cash equivalents of assets existing at beginning
of period
26,396
30,305
EFFECT OF CHANGE IN BASIS OF CONSOLIDATION
0
0
CASH AND CASH EQUIVALENTS AT END OF PERIOD
55,583
26,396
Held-for-sale assets and minority interests
0
0
CASH AND CASH EQUIVALENTS AT END OF PERIOD
55,583
26,396
(*) Restated for the retroactive application of IFRS 10
Pursuant to Consob Resolution 15519 of 27 July 2006, the impact of dealings with related parties on the Statement of Financial
Position, Income Statement and Cash Flow Statement is explained in the notes to the Financial Statements.
DeA Capital - Annual Financial Statements to 31 December 2014
81

Statement of changes in consolidated shareholders’ equity
Share
Share
premium
Legal Fair value
(EUR thousand)
capital
reserve
reserve
reserve
Financial statements for the year ending 31 December 2012
274,606
386,452
61,322
91,905
Allocation of 2012 net profit
0
0
0
Cost of stock options
0
0
0
0
Purchase of own shares
(631)
(254)
0
0
Other changes
0
0
0
0
Total comprehensive profit/(loss)
0
0
0
(63,180)
Total at 31 December 2013
273,975
386,198
61,322
28,725
(*) Restated for the retroactive application of IFRS 10
Share
Share
premium
Legal Fair value
(EUR thousand)
capital
reserve
reserve
reserve
Total at 31 December 2013
273,975
386,198
61,322
28,725
Allocation of 2013 net profit
0
0
0
Cost of stock options
0
0
0
0
Purchase of own shares
(2,349)
(1,371)
0
0
Other changes
0
0
0
0
Total comprehensive income
0
0
0
87,690
Total at 31 December 2014
271,626
384,827
61,322
116,415
Pursuant to Consob Resolution 15519 of 27 July 2006, the impact of dealings with related parties on the Statement of
Financial Position, Income Statement and Cash Flow Statement is explained in the notes to the Financial Statements.
82 DeA Capital - Annual Financial Statements to 31 December 2014
Consolidated
Other
Profit (loss)
Profit (loss)
Non-controlling
shareholders’
reserves carried forward
for the Group
Group total
interests (*)
equity
(10,444)
(54,426)
(26,277)
723,138
136,309
859,447
0
(26,277)
26,277
0
0
0
(6)
0
0
(6)
0
(6)
0
0
0
(885)
0
(885)
1,552
0
0
1,552
57,387
58,939
0
0
(31,130)
(94,310)
(16,626)
(110,936)
(8,898)
(80,703)
(31,130)
629,489
177,070
806,559
Consolidated
Other
Profit (loss)
Profit (loss)
Non-controlling
shareholders’
reserves carried forward
for the Group
Group total
interests
equity
(8,898)
(80,703)
(31,130)
629,489
177,070
806,559
0
(31,130)
31,130
0
0
0
18
0
0
18
0
18
0
0
0
(3,720)
0
(3,720)
(2,363)
0
0
(2,363)
(6,166)
(8,529)
0
0
(57,601)
30,089
2,205
32,294
(11,243)
(111,833)
(57,601)
653,513
173,109
826,622
DeA Capital - Annual Financial Statements to 31 December 2014
83


Notes to the
Accounts Consolidated Financial
Statements for the Year
Ending 31 December 2014
DeA Capital - Annual Financial Statements to 31 December 2014
85

Notes to the Consolidated Financial Statements for the Year Ending
31 December 2014
A. Structure and content of the consolidated financial statements
The Consolidated Financial Statements for the Year Ending 31 December 2014 include the Parent Company DeA Capital S.p.A. and
all
subsidiaries (the Group), and were prepared using the separate
financial statements of the companies included in the basis of
consolidation
corresponding to the relevant individual statements, restated as
necessary, to adapt them to the accounting standards
listed below as dictated by Italian law.
The Consolidated Financial Statements were prepared in accordance with the general principles of IAS 1, specifically:
- the matching principle: the effect of events and transactions is recorded when they occur, and not when payment is made or
received;
- the going concern principle: the financial statements are prepared under the assumption that business operations will continue
in
the near future. In this regard, the directors have evaluated this
assumption with particular scrutiny in light of the current
economic
and financial crisis. As indicated in the section ‘Main risks and
uncertainties’ in the Report on Operations, the directors
believe
that the risks and uncertainties described therein are not critical in
nature, confirming the financial solidity of the DeA
Capital S.p.A. Group;
- materiality: when reporting operating events in accounting entries, preference is given to the principle of economic substance
over form;
- comparative information: the Consolidated Financial Statements must show comparative information for the previous period.
The Consolidated Financial Statements consist of the Statement of Financial Position, the Income Statement, the Statement of
Changes in Shareholders’ Equity, the Cash Flow Statement, the Statement of Comprehensive Income (Statement of Performance -
IAS 1) and the Notes to the Consolidated Financial Statements. The Consolidated Financial Statements are also accompanied by the
Report on Operations and a Statement of Responsibilities for the Accounts pursuant to art. 154-bis of Legislative Decree 58/98.
The
Statement of Financial Position provides a breakdown of current and
non-current assets and liabilities with separate reporting
for those resulting from discontinued or held-for-sale operations. In the Income Statement, the Group has adopted the nature of
expense method, whereby costs and revenues are classified according to type. The Cash Flow Statement is prepared using the
“direct method”.
Unless
otherwise indicated, all tables and figures included in these notes to
the Financial Statements are reported in EUR thousand.
In addition to the figures at 31 December 2014, the Financial Statement formats used also provide comparable figures for
31 December 2013.
The
publication of the Consolidated Financial Statements for the Year
Ending 31 December 2014 was authorised by resolution of the
Board of Directors dated 12 March 2015.
Statement of compliance with accounting standards
The Consolidated Financial Statements for the Year Ending 31 December 2014 (2014 Consolidated Financial Statements) have
been prepared in accordance with the International Accounting Standards adopted by the European Union and approved by
the date the Financial Statements were prepared (International Accounting Standards, or individually IAS/IFRS, or collectively
IFRS
(International Financial Reporting Standards)). IFRS also means all
interpretations of the International Financial Reporting
Interpretations Committee (IFRIC), including those previously issued by the Standing Interpretations Committee (SIC), and
approved by the European Union.
The Consolidated Financial Statements were prepared with a focus on clarity, and provide a true and fair view of the assets,
financial situation, operating result and cash flows for the period.
Accounting standards, amendments and interpretations applied as of 1 January 2014
The IASB-approved international accounting standards and interpretations authorised for adoption in Europe that were applied
for
the first time from 1 January 2014 are detailed below. Following the
adoption of IFRS 10 as described below, if shareholdings
86 DeA Capital - Annual Financial Statements to 31 December 2014
in jointly-controlled companies or shareholdings in associated companies are held by mutual funds, investment funds or similar
entities, then these shareholdings are valued at fair value through profit and loss.
The Group did not apply any IFRS in advance.
IFRS 10 (Consolidated Financial Statements)
On 12 May 2011, the IASB published the accounting standard IFRS 10 (Consolidated Financial Statements), which is intended to
replace IAS 27 (Consolidated and Separate Financial Statements) and SIC 12 (Consolidation - Special Purpose Entities). The new
standard
sets out a single model of consolidation that identifies control as the
basis for the consolidation of all types of entities.
The new standard defines the concept of control on the basis of the concurrence of three essential elements:
• power over the investee company;
• exposure to or the right to variable returns from its involvement with the investee company;
• the ability to use that power over the investee to affect the amount of the investor's returns.
Adopting IFRS 10 had the following effects on the comparative values:
IFRS 10 effect
Reclassification
Figures
Equity
Recalculated
of the IDeA OF I
originally
valuation
figures equity
valuation: from
Inter-
Recalculated
published -
of minority
valuation of
equity basis
company
figures -
Financial Year
interests of of
100% of the
to line-by-line
elimination
Financial
(EUR thousand)
2013
IDeA OF I
IDeA OF I fund
consolidation
item
Year 2013
Alternative Asset
Management fees
78,810
0
78,810
0
(2,454)
76,356
Profit/(loss) from
investments valued at
equity
1,861
(5,330)
(3,469)
10,055
0
6,586
Other investment income/
charges
(18,217)
0
(18,217)
(6,400)
0
(24,617)
Service revenues
16,329
0
16,329
0
0
16,329
Other revenues and income
3,906
0
3,906
126
0
4,032
Personnel costs
(28,241)
0
(28,241)
0
0
(28,241)
Service costs
(21,570)
0
(21,570)
(3,781)
2,454
(22,897)
Depreciation, amortisation
and write-downs
(73,284)
0
(73,284)
0
0
(73,284)
Other charges
(5,074)
0
(5,074)
0
0
(5,074)
Financial income
5,991
0
5,991
1
0
5,992
Financial charges
(6,430)
0
(6,430)
0
0
(6,430)
PROFIT (LOSS) BEFORE
TAXES
(45,919)
(5,330)
(51,249)
1
0
(51,248)
Income tax
(4,380)
0
(4,380)
(1)
0
(4,381)
PROFIT (LOSS)
FOR THE YEAR
FROM CONTINUING
OPERATIONS
(50,299)
(5,330)
(55,629)
(0)
0
(55,629)
Profit/(loss) from assets
held-for-sale/sold
0
0
0
0
0
0
PROFIT (LOSS) FOR THE
YEAR
(50,299)
(5,330)
(55,629)
(0)
0
(55,629)
- Profit/(loss)
attributable to the
Group
(31,130)
0
(31,130)
0
0
(31,130)
- Profit/(loss)
attributable to
minorities
(19,169)
(5,330)
(24,499)
0
0
(24,499)
DeA Capital - Annual Financial Statements to 31 December 2014
87
Figures
Figures
originally
recalculated at
published at 31
31 December
(EUR thousand)
December 2013
IFRS 10 effect
2013
CONSOLIDATED ASSETS
Non-current assets
Tangible and intangible assets
Goodwill
166,315
0
166,315
Intangible fixed assets
78,463
0
78,463
Tangible fixed assets
4,855
0
4,855
Total intangible and tangible assets
249,633
0
249,633
Financial Investments
Investments in associates
296,975
(56,891)
240,084
Investments held by Funds
0
114,225
114,225
- available-for-sale investments
0
78,261
78,261
- investments in associates and JVs recognised in income statement
0
35,964
35,964
Available-for-sale investments in other companies
132,536
0
132,536
Available-for-sale funds
166,260
0
166,260
Other available-for-sale financial assets
330
0
330
Total financial investments
596,101
57,333
653,434
Other non-current assets
Deferred tax assets
2,657
0
2,657
Loans and receivables
30,372
0
30,372
Tax receivables from parent companies relating to tax consolidation
scheme
2,984
0
2,984
Other non-current assets
26,168
6,300
32,468
Total non-current assets
62,181
6,300
68,481
Total non-current liabilities
907,915
63,633
971,548
Current assets
Trade receivables
21,078
0
21,078
Available-for-sale financial assets
5,464
0
5,464
Tax receivables from parent companies relating to tax consolidation
scheme
3,467
0
3,467
Other tax receivables
4,649
263
4,912
Other receivables
18,350
66
18,416
Cash and cash equivalents
26,096
300
26,396
Total current assets
79,104
629
79,733
Total current assets
79,104
629
79,733
Assets held for sale
1,285
0
1,285
TOTAL CONSOLIDATED ASSETS
988,304
64,262
1,052,566
CONSOLIDATED SHAREHOLDERS' EQUITY AND LIABILITIES
CONSOLIDATED SHAREHOLDERS' EQUITY
Group shareholders' equity
629,489
0
629,489
Minority capital and reserves
112,890
64,180
177,070
Consolidated shareholders’ equity
(Group and non-controlling interests)
742,379
64,180
806,559
CONSOLIDATED LIABILITIES
Non-current liabilities
Deferred tax liabilities
19,537
0
19,537
End-of-service payment fund
3,529
0
3,529
Financial liabilities
150,198
0
150,198
Payables to staff
406
0
406
Total non-current liabilities
173,670
0
173,670
Current liabilities
Payables to suppliers
15,516
83
15,599
Payables to staff and pension institutions
6,833
0
6,833
Current payables to tax authorities
6,956
0
6,956
Other tax payables
1,478
0
1,478
Other payables
2,054
0
2,054
Short-term financial payables
39,418
0
39,418
Total current liabilities
72,255
83
72,338
Liabilities held for sale
0
0
0
TOTAL CONSOLIDATED LIABILITIES AND SHAREHOLDERS’
EQUITY
988,304
64,263
1,052,567
88 DeA Capital - Annual Financial Statements to 31 December 2014

IFRS 11 (Joint arrangements)
On 12 May 2011, the IASB published the accounting standard IFRS 11 (Joint arrangements), which is intended to replace IAS
31 (Interests in joint ventures) and SIC 13 (Jointly controlled entities - non-monetary contributions by venturers). The new
standard governs the principles for reporting all joint arrangements. These are divided into two categories, according to the
economic substance of the arrangements between the parties:
• joint operations, whereby the parties to the arrangement acquire rights to certain assets and assume obligations for certain
liabilities;
• joint ventures, whereby the parties have rights to the net value of a set of jointly controlled assets and liabilities.
In the first case, the investor recognises the assets and liabilities acquired (along with the associated income and expense)
according
to the IAS/IFRS standards governing the individual elements; in the
second, the pro-rata interest in the joint venture is
recognised using the equity method.
IFRS 12 (Disclosure of interests in other entities)
On 12 May 2011, the IASB published the accounting standard IFRS 12 (Disclosure of interests in other entities) regarding the
information
to be provided in the financial statements on interests in other
entities, including subsidiaries, associates and joint
ventures. This information must enable users of the financial statements to understand the nature of the risks associated with
the investments in strategic shareholdings that will form part of the company's assets over the long term. The information
must also indicate the effects of these investments on the assets, financial position, operating result and cash flows.
Amendments to IAS 32: Offsetting financial assets and financial liabilities)
On 16 December 2011, the IASB published a number of amendments to IAS 32 (Financial instruments: presentation), clarifying
how certain criteria for offsetting financial assets and liabilities, as set out in IAS 32, should be applied.
Transition Guidance (Amendments to IFRS 10, IFRS 11 and IFRS 12)
On 28 June 2012, the IASB published “Consolidated Financial Statements, Joint Arrangements and Disclosure of Interests in
Other Entities: Transition Guidance (Amendments to IFRS 10, IFRS 11 and IFRS 12)”.
Investment Entities (Amendments to IFRS 10, IFRS 12 and IAS 27)
On 31 October 2012, the IASB published “Investment Entities (amendments to IFRS 10, IFRS 12 and IAS 27)”. The change
introduced an exception to IFRS 10, which stipulates that investment entities value certain subsidiaries at fair value on the
income statement instead of consolidating them.
Recoverable Amount Disclosures for Non-Financial Assets (Amendments to IAS 36)
On 29 May 2013, the IASB published the document “Recoverable Amount Disclosures for Non-Financial Assets”, which clarifies
that the disclosure to be made concerning the recoverable value of assets that have undergone a fall in value only concerns
those assets whose recoverable value is based on fair value net of sales costs.
Future accounting standards, amendments and interpretations
Accounting standards, amendments and interpretations that are not yet applicable and have not
been adopted in advance by the Group, but were approved for adoption in the European Union as of
28 February 2015
The International Accounting Standards, together with the interpretations and changes to existing IASB-approved accounting
standards and interpretations that were ratified for adoption in the European Union on 28 February 2015, are as follows:
IFRIC 21 - Levies
On 20 May 2013, the IASB published the interpretation “IFRIC 21 - Levies”, to describe the accounting of levies imposed
by the tax authorities, as well as current taxes. The interpretation deals with the issue of recognising costs that
companies must sustain for tax payments. IFRIC 21 is an interpretation of IAS 37 (Provisions, Contingent Liabilities and
Contingent Assets).
IFRIC 21 applies to financial periods commencing on or after 17 June 2014.
DeA Capital - Annual Financial Statements to 31 December 2014
89

IAS 19 - Employee benefits
On 21 November 2013, the IASB published some minor amendments to IAS 19 (Employee benefits), entitled “Defined benefit
plans: employee contributions”. The amendments simplify the accounting requirements for contributions to defined benefit
plans from employees or, in certain cases, third parties.
The amendments are applicable retrospectively for financial periods starting 1 July 2014, but may be applied in advance.
Improvements to IFRS - 2010-2012 and 2011-2013 cycles
On 12 December 2013, the IASB issued a set of amendments to the IFRS (“Annual Improvements to IFRS - 2010-2012 Cycle” and
“Annual Improvements to IFRS - 2011-2013 Cycle”). The most important issues dealt with in these amendments were:
-
the amendments to the definitions of vesting condition and market
condition as well as to the definitions of performance condition
and service condition (previously included in the definition of vesting condition) in IFRS 2 (Share-based payments);
- information on estimates and assessments used in aggregating operating segments in IFRS 8 (Operating segments);
- the identification and disclosure of a transaction with a related party that arises when a management entity provides key
management personnel services to the company that prepares the accounts in IAS 24 (Related party transactions);
- the exclusion of all types of joint arrangements from the scope of application of IFRS 3 (Business combinations).
These amendments take effect for annual periods starting from 1 July 2014, but can be applied in advance.
We
do not anticipate that the potential adoption of the standards and
interpretations noted above will have a material impact on the
valuation of the DeA Capital Group's assets, liabilities, costs and revenues.
Accounting principles, amendments and interpretations that are not yet applicable, have not been
adopted in advance by the Group and are not yet approved for adoption in the European Union
as of 28 February 2015
The International Accounting Standards, interpretations and changes to existing IASB-approved accounting standards and
interpretations that had not been ratified for adoption in the European Union as of 28 February 2015 are as follows:
IFRS 9 (Financial instruments)
On 12 November 2009, the IASB published the first part of IFRS 9 (Financial instruments). It was subsequently reissued
in October 2010 and amended in November 2013. The standard, which introduces changes to both the recognition and
measurements of financial assets and liabilities, and hedge accounting, will fully replace IAS 39 (Financial instruments:
recognition and measurement).
The standard, which is awaiting ratification by the European Commission, will come into force on 1 January 2018, but can be
applied in advance.
IFRS 14 (Regulatory Deferral Accounts)
On 30 January 2014, the IASB published IFRS 14 (Regulatory Deferral Accounts), which allows only those adopting the IFRS
for the first time to continue to report amounts relating to rate regulation according to the previously adopted accounting
standards. In order to improve comparability with companies that already apply the IFRS and that do not report these
amounts, the standard requires the effect of rate regulation to be presented separately from other items.
The standard, which is awaiting ratification by the European Commission, will come into force on 1 January 2016, but can be
applied in advance.
Amendments to IFRS 11 (Joint arrangements)
On 6 May 2014, the IASB issued some amendments to IFRS 11 (Joint arrangements: accounting for acquisitions of interests
in joint operations) to clarify the accounting requirements for acquisitions in joint operations that constitute a business.
The amendments are applicable retrospectively for annual periods starting from 1 January 2016, but can be applied in
advance.
Amendments to IAS 16 (Property, plant and equipment), and to IAS 38 (Intangible assets)
On 12 May 2014, the IASB issued an amendment to IAS 16 (Property, plant and equipment) and to IAS 38 (Intangible assets).
The IASB clarified that the use of revenue-based methods to calculate the depreciation of an asset is not appropriate because
revenue generated by an activity that includes the use of an asset generally reflects factors other than the consumption of
90 DeA Capital - Annual Financial Statements to 31 December 2014

the economic benefits embodied in the asset. The IASB also clarified that revenue is generally presumed to be an appropriate
basis for measuring the consumption of the economic benefits embodied in an intangible asset. This presumption, however,
can be rebutted in certain limited circumstances.
These amendments take effect for annual periods starting from 1 January 2016, but can be applied in advance.
IFRS 15 (Revenue from contracts with customers)
On 28 May 2014, the IASB issued IFRS 15 (Revenue from contracts with customers). The standard replaces IAS 18 (Revenue),
IAS 11 (Construction contracts), and the interpretations SIC 31, IFRIC 13 and IFRIC 15, and requires revenues reported when the
control
of assets or services is transferred to clients to reflect the amount
that is expected to be received in exchange for these
goods and services.
The new model for reporting revenues has five steps for recognising revenue from contracts with customers:
- identifying contracts with the customer;
- identifying performance obligations, i.e. contractual commitments to transfer goods or services to a customer;
- determining the transaction price;
- allocating transaction prices to performance obligations;
- reporting the revenues when the relevant performance obligation has been fulfilled.
The
standard is applicable for annual periods starting after 1 January
2017, and must be fully or partially applied retrospectively.
Amendments to IAS 27: Equity Method in Separate Financial Statements
On 12 August 2014, the IASB issued an amendment - “Equity Method in Separate Financial Statements” - to IAS 27.
The objective of the amendment to IAS 27 is to allow parent companies to use the equity method to account for investments in
associate companies and joint ventures in the separate financial statements.
The amendments, which are awaiting ratification by the European Commission, will come into force on 1 January 2016, but can be
applied in advance.
Improvements to IFRS - 2012-2014 cycle
On 25 September 2014, the IASB issued a set of amendments to IFRSs (Annual Improvements to IFRSs - 2012-2014 Cycle). The
most important issues dealt with in these amendments were:
- the amendment that introduces some specific guidance to IFRS 5 for cases in which an entity reassigns an asset from the held-
for-sale
category to the held-for-distribution category (or vice versa), or when
the requirements for classifying an asset as held-
for-distribution
are not met. The amendments specify that these reclassifications should
not be considered as a change to a sales
plan or to a distribution plan and that the criteria for classification and valuation remain valid;
-
as regards IFRS 7, the amendment covers the introduction of further
guidance to clarify whether a servicing contract constitutes a
continuing involvement in a transferred asset for the purposes of transfer disclosure requirements;
-
the amendment introduced in IAS 19 clarifying that the high quality
corporate bonds used to determine the discount rate for post-
employment benefits should be issued in the same currency in which the benefits are paid;
-
the amendments to IAS 34 to clarify the requirements if the requested
information is presented in the interim financial report but
not in the interim financial statements.
The amendments, which are awaiting ratification by the European Commission, will come into force on 1 January 2016, but can be
applied in advance.
Amendments to IAS 1 (Disclosure Initiative)
On 18 December 2014, the IASB issued an amendment - “Disclosure Initiative” - to IAS 1.
The most important issues dealt with in these amendments were:
- clarification that the items on the statement of financial position, the income statement and the statement of comprehensive
income can be disaggregated or aggregated depending on their materiality;
- clarification that the OCI stake in an associate company or joint venture is presented as a single item, independently of its
subsequent recycling in the income statement.
The amendment, which is awaiting ratification by the European Commission, will come into force on 1 January 2016, but can be
applied in advance.
DeA Capital - Annual Financial Statements to 31 December 2014
91

Amendments to IFRS 10, IFRS 12 and IAS 28 (Investment Entities - Applying the Consolidation
Exception)
On 18 December 2014, the IASB issued the amendment - “Investment Entities: Applying the Consolidation Exception
(amendments to IFRS 10, IFRS 12 and IAS 28)” with the objective of clarifying issues relating to the consolidation of an
investment entity. More specifically, the amendment to IFRS specifies that a parent company (an intermediate parent,
i.e. not an investment entity), which in turn is a subsidiary of an investment entity, is not obliged to prepare consolidated
financial statements, even if the investment entity values subsidiaries at fair value, in accordance with IFRS 10. Prior to this
amendment, under IFRS 10 a parent company was not obliged to present consolidated financial statements on condition that
its parent company draft consolidated financial statements that comply with IFRS. Following this amendment, the exemption
from preparing consolidated financial statements has been extended to intermediate parents which in turn are subsidiaries of
an investment entity, even if the latter values its subsidiaries at fair value rather than consolidating them.
The amendment, which is awaiting ratification by the European Commission, will come into force on 1 January 2016, but can
be applied in advance.
Amendments to IFRIC 10 and IAS 28 (Sale or Contribution of Assets between an Investor and its
Associate or Joint Venture)
On 11 September 2014, the IASB published the document “Sale or Contribution of Assets between an Investor and its
Associate or Joint Venture (Amendments to IFRS 10 and IAS 28)”.
The objective of the amendments is to clarify accounting treatment, both in the event of a parent losing control of a subsidiary
(governed by IFRS 10) and in the case of downstream transactions (governed by IAS 28), according to whether or not the
object
of the transaction is a business, as defined by IFRS 3. If the object
of the transaction is a business, the profit must be
reported
in full in both the above cases, whereas if the object of the
transaction is not a business, the profit must be reported
only for the portion relating to minority interests.
The Group will adopt these new standards, amendments and interpretations based on the stipulated date of application, and
will assess their potential impact when they have been ratified by the European Union.
Basis of consolidation
As a result of the events described in the Report on Operations, the basis of consolidation at 31 December 2014 changed compared
with 31 December 2013, due to:
• full consolidation, line by line, of IDeA OF I Fund (considered at equity value at 31 December 2013)
• acquisition of shares in Innovation Real Estate, including special shares (with limited economic rights), equating to 13.3% of
capital;
• the merger by incorporation in DeA Capital S.p.A. of wholly-owned Luxembourg subsidiary DeA Capital Investments S.A.;
• the merger by incorporation in DeA Capital Real Estate of the wholly-owned Italian subsidiary I.F.IM. (IFIM);
• the founding of IDeA Real Estate, on 9 December 2014, by DeA Capital Real Estate.
92 DeA Capital - Annual Financial Statements to 31 December 2014

As a result, at 31 December 2014, the following companies formed part of the DeA Capital Group's basis of consolidation:
Share
Name
Head office Currency
capital
% holding
Consolidation method
Parent
DeA Capital S.p.A.
Milan, Italy
Eur
306,612,100
company
Sigla Luxembourg S.A.
Luxembourg
Eur
482,684
41.39%
Equity accounted (IAS 28)
IDeA Capital Funds SGR S.p.A.
Milan, Italy
Eur
1,200,000
100.00%
Full consolidation (IAS 27)
IDeA OF I
Milan, Italy
Eur
-
46.99%
Full consolidation (IAS 27)
Atlantic Value Added
Rome, Italy
Eur
-
27.27%
Equity accounted (IAS 28)
DeA Capital Real Estate S.p.A.
Milan, Italy
Eur
600,000
100.00%
Full consolidation (IAS 27)
Innovation Real Estate S.p.A.
Milan, Italy
Eur
597,725
96.99%
Full consolidation (IAS 27)
Innovation Real Estate Advisory S.r.l. Milan, Italy
Eur
105,000
96.99%
Full consolidation (IAS 27)
IDeA FIMIT SGR S.p.A.
Rome, Italy
Eur
16,757,574
64.30%
Full consolidation (IAS 27)
IDeA FIMIT Sviluppo Fund
Rome, Italy
Eur
-
50.00%
Full consolidation (IAS 27)
IDeA Real Estate S.p.A.
Milan, Italy
Eur
50,000
100.00%
Full consolidation (IAS 27)
The above list meets the requirements of Consob Resolution 11971 of 14 May 1999 and subsequent amendments (art. 126 of the
Regulation).
Consolidation method
Subsidiaries are consolidated on a line-by-line basis from their date of acquisition, i.e. on the date the Group acquires a
controlling interest, and they cease to be consolidated when control is transferred outside the Group.
Subsidiaries are those companies in which the Parent Company, directly or indirectly through subsidiaries, holds a majority
of the capital subscribed and/or voting rights, or over which the Parent Company exercises de facto control allowing it to
direct the financial and operating policies of the subsidiary pursuant to the articles of association or by agreement.
The financial statements of subsidiaries are prepared for each period using the same accounting standards used by the
Parent Company.
The main criteria adopted to apply this method are indicated below:
- the financial statements of the Parent Company and subsidiaries are incorporated on a “line-by-line” basis;
- the carrying value of the investment is offset against the corresponding net equity figure. When a company is included in the
basis
of consolidation for the first time, the difference between the
acquisition cost and the net equity of the investee companies
is
posted, if the conditions are right, to the assets or liabilities
included in the consolidation, pursuant to the provisions of IFRS
3.
Any residual portion is taken to the income statement if negative, or
recorded as a specific item, ‘goodwill’, under assets if
positive.
The latter is subject to an annual impairment test. Alternatively, when
a company is included in the basis of consolidation
for the first time, the entire amount may be recorded as goodwill including the portion relating to the minority interests (full
goodwill approach);
- significant transactions between consolidated companies are eliminated as are payables and receivables and unrealised profits
resulting from transactions between Group companies net of any tax impact;
-
the portions of shareholders' equity pertaining to minority
shareholders are reported, along with the respective share of net profit
for the period, in appropriate shareholders' equity items.
DeA Capital - Annual Financial Statements to 31 December 2014
93

B. Measurement criteria adopted
The measurement criteria adopted on the basis of International Accounting Standards and reported below are consistent with the
going concern principle and have not changed from those used in the preparation of the Consolidated Financial Statements for
the Year Ending 31 December 2013 and the Summary Consolidated Half-year Financial Statements at 30 June 2014 except as a
result of the application of new IAS/IFRS accounting standards as described above.
Current and non-current assets and liabilities
An asset is considered current if it meets at least one of the following conditions:
• it is expected to be converted during the company's normal operating cycle. The “company's operating cycle” means the period
from the acquisition of an asset to its conversion to cash and cash equivalents. When the company's operating cycle cannot be
clearly identified, its duration is assumed to be twelve months;
• it is held mainly for trading purposes;
• its conversion is expected to occur within 12 months following the end of the financial year;
•
it consists of cash and cash equivalents which have no restrictions
that would limit its use in the 12 months following the end of
the financial year.
All other assets are carefully analysed to separate the “current” portion from the “non-current” portion.
Furthermore, deferred tax assets are recorded under non-current components.
A liability is considered current if it meets at least one of the following conditions:
• it is expected to be settled during the company's normal operating cycle;
• it is held mainly for trading purposes;
• its settlement is expected to occur within 12 months following the end of the financial year;
•
the company does not have an unconditional right to defer payment of
the liability for at least 12 months following the end of the
financial year.
All other liabilities are carefully analysed to separate the “current portion” from the “non-current” portion.
Furthermore, deferred tax liabilities are recorded under non-current components.
Intangible assets
Intangible assets are those assets with no physical form that can be identified and produce future economic benefits. They are
recorded
under assets when it is likely that their use will generate future
economic benefits and when their cost can be reliably
determined. The above assets are recorded at purchase cost, or at production cost if they are generated internally.
The purchase cost is represented by the fair value of the price paid to acquire the asset and by all other direct costs incurred
to prepare the asset for use.
The carrying value of intangible assets is maintained in the financial statements to the extent that there is evidence that this
value can be recovered through use or if it is likely that these assets will generate future economic benefits.
The useful life of intangible assets is assessed as finite or indefinite.
Intangible
assets with an indefinite useful life are tested to check that their
value is still appropriate at any time when there
are indications of possible impairment as required by IAS 36 (Impairment of assets). Intangible assets with an indefinite
useful
life are not amortised. The useful life of an intangible asset with an
indefinite life is reviewed annually to check that the
underlying conditions for the classification continue to apply. For additional details, please see the section ‘Impairment’.
Except
for intangible assets involving rights connected with final variable
commissions, intangible assets with a finite useful life
are amortised on a straight-line basis over their useful life.
The amortisation method used for rights connected with final variable commissions reflects changes in future economic
benefits associated with the recognition of the related revenues.
The
useful life of these intangible assets is tested to check that their
value is still appropriate whenever there are indications of
possible impairment.
94 DeA Capital - Annual Financial Statements to 31 December 2014

Impairment - IAS 36
Impairment always occurs when the carrying value of an asset is greater than its recoverable value. On each reporting date, the
company determines whether there are any indications that an asset may be impaired. If such indications exist, the recoverable
value
of the asset is estimated (impairment test) and any write-down is
recorded. The recoverable value of an asset is the higher of
its fair value less costs to sell the asset and its value in use.
IAS 36 provides instructions on determining fair value less costs to sell an asset, as follows:
• if there is a binding sales agreement, the asset's fair value is the negotiated price;
•
if there is no agreement, but the asset is marketed in an active
market, the fair value is the current bid price (thus, the exact
price on the value date and not the average price);
•
if no prices can be found in active markets, fair value must be
determined based on valuation methods that incorporate the best
information available including any recent transactions involving the same asset, after verifying that there were no significant
changes in the economic environment between the date of the transactions under consideration and the valuation date.
IAS 36 defines value in use as the present value of future cash flows that an asset is projected to produce. The estimate of the
value in use must include the items listed below:
• an estimate of future cash flows that the company expects to derive from the asset;
• expectations of potential changes in value and the timing of such cash flows;
• the time value of money;
• other factors such as the volatility of the asset's value and the lack of a liquid market for it.
For more information on determining value in use, please see Appendix A of IAS 36. However, the main elements for accurately
estimating
the value in use are: an appropriate calculation of projected cash
flows (for which the investee company's business plan
is
essential) and their timing, as well as the application of the right
discount rate that accounts for both the present value of money
and the specific risk factors for the asset to be valued.
In all cases, when calculating the value it is important to:
• base cash flow projections on reasonable and sustainable assumptions that provide the best estimate of the economic conditions
that are likely to exist over the remaining useful life of the asset;
• base cash flow projections on the most recent budget/plan approved by the investee company, which, however, must exclude
any future inflows or outflows of cash that are expected to come from the future restructuring, improvement or optimisation of
operating performance. Projections based on these budgets/plans must cover a maximum period of five years unless a longer
period of time can be justified;
• estimate higher cash flow projections for the period covered by the most recent budgets/plans by extrapolating projections
based on the budgets/plans taken into consideration, and using a stable or declining growth rate for subsequent years unless
a rising rate can be justified. This growth rate must not exceed the average long-term growth rate for production in the
country or countries in which the investee company operates or for markets in which the asset used is placed unless a higher
rate can be justified.
The assumptions used to determine cash flow projections must be reasonable, and based partly on an analysis of the factors that
generated differences between projections of past and current cash flows. In addition, the assumptions used to determine current
cash
flow projections must be checked to ensure that they are consistent
with actual past results, unless in the meantime changes
have
occurred in the investee company's business model or in the economic
environment in which it operates that justify changes in
respect of the past.
Tangible assets
Tangible assets are recorded at purchase price or production cost adjusted for accumulated depreciation and any impairment.
Their cost includes ancillary costs and direct and indirect costs incurred at the time of purchase necessary to make the asset
usable. The purchase cost is represented by the fair value of the price paid to acquire the asset and by all other direct costs
incurred
to prepare the asset for use.. Tangible assets are depreciated on a
straight-line basis over their remaining useful life,
using the depreciation rates indicated in the notes on the item relating to similar groups of assets. If factors are discovered
that lead the company to believe that it may be difficult to recover the net carrying value, an impairment test is performed. If
the reasons for the impairment cease to exist, the carrying value of the asset is increased to its recoverable amount.
DeA Capital - Annual Financial Statements to 31 December 2014
95

Associates
These are companies in which the Group holds at least 20% of the voting rights or exercises significant influence, but not full
or
joint control over their financial and operating policies. The
consolidated financial statements include the Group’s share of its
associates'
results, which are reported using the equity method, starting on the
date on which significant influence began until the
significant influence ceases to exist.
If the Group's share of an associate's losses exceeds the carrying value of the equity investment reported in the financial
statements,
the carrying value of the equity investment is eliminated, and the
share in further losses is not reported unless, and to
the extent that, the Group is legally liable for such losses.
When
the equity investment is acquired, any difference between its cost and
the Parent Company's stake in the net fair value of the
associate's
identifiable assets, liabilities and contingent liabilities is recorded
as required by IFRS 3, i.e. any goodwill is included in
the carrying value of the equity investment.
As
governed by IAS 28.33, since the goodwill included in the carrying
value of an equity investment in an associate is not recorded
separately,
it is not subject to a separate impairment test pursuant to IAS 36
(Impairment of assets). Instead, the entire carrying
value
of the equity investment is subject to an impairment test pursuant to
IAS 36 by comparing its recoverable value (the greater
of
its value in use and the fair value adjusted for sales costs) and
carrying value whenever there is evidence indicating the possible
impairment of the equity investment as set out in IAS 28.
Financial assets
Based on the classification of financial assets required by IAS 39, the Group classified its financial assets at the time of the
transition to International Accounting Standards, and subsequently when individual financial assets were acquired.
Minority
interests and investments in funds, which constitute the main,
predominant area of the Group's operations, are classified
under available-for-sale assets, which are recorded at fair value with a balancing item in shareholders' equity.
IFRS
13.9 provides a “new” definition of fair value. It represents “the
price that would be received to sell an asset or paid to transfer
a liability in an orderly transaction between market participants at the measurement date”.
The concept of fair value is characterised by the following features:
1. it is fundamentally related to the free market and the values reflected therein;
2. it is calculated using the exit price as the relevant price;
3. it relates to the date on which the measurement is made;
4.
it relates to an “orderly” transaction, i.e. it is not a forced
transaction, such as a compulsory administrative liquidation or a sale
at
below cost.
Assets and liabilities measured at fair value may be:
• stand-alone assets or liabilities (financial or non-financial instruments);
• a group of assets, a group of liabilities or a group of assets and liabilities.
In the case of assets not listed in active markets, such as the Group's direct investments in companies, investments in
venture capital funds and funds of funds, the fair value reported in the Financial Statements is determined by the directors
based on their best judgment and estimation, using the knowledge and evidence available when the Financial Statements
are prepared.
In these cases, it is provided that:
•
if there are recent transactions related to the same financial
instrument, these may be used to determine fair value after verifying
that there have been no significant changes in the economic environment between the date of the transactions being considered
and the valuation date;
•
if there are transactions involving similar financial instruments,
these may be used to determine fair value after verifying the
similarity (as a function of the type of business, size, geographic market, etc.) between the instrument for which transactions
have been found and the instrument to be valued;
•
if no prices can be found in active markets, fair value must be
determined using valuation models that account for all factors that
market participants would consider in setting a price.
96 DeA Capital - Annual Financial Statements to 31 December 2014

However,
due to objective difficulties in making assessments and the absence of a
liquid market, the values assigned to such assets
could differ, and in some cases significantly, from those that could be obtained when the assets are sold.
Direct
investments in companies that are not subsidiaries or associates and in
funds are classified as available-for-sale financial
assets,
which are initially reported at fair value on the date of the original
posting. These assets are measured at fair value when all
interim and full-year financial statements are prepared.
Gains
and losses from fair value measurement are posted to a special
shareholders' equity reserve called the “fair value reserve”
until
the investment is sold or otherwise disposed of, or until impairment
occurs, in which cases the gain or loss previously recorded
in the fair value reserve is posted to the Income Statement for the period.
On
the date of the annual or interim financial statements (IAS 34), a test
is performed as to the existence of objective evidence of
impairment
following one or more events that have occurred after the initial
recording of the asset, and this event (or events) has
an impact on the estimated cash flow from the financial asset.
For
equity instruments, a significant or prolonged reduction in fair value
below their cost is considered to be objective evidence of
impairment.
Although International Accounting Standards introduced an important reference to quantitative parameters that must be adhered
to, they do not govern quantitative limits to determine when a loss is significant or prolonged.
Thus, the DeA Capital Group has an accounting policy that defines these parameters. In particular, “significant” means there has
been
an objective reduction in value when fair value is more than 35% below
its historical cost. In this case, impairment is recorded
in the Income Statement without further analysis.
The
duration of the reduction in value is deemed to be prolonged when the
reduction of fair value below historical cost continues for
a period of over 24 months. After exceeding 24 months, impairment is recorded in the Income Statement without further analysis.
Derivatives
Derivatives
are recorded in the Statement of Financial Position at fair value
calculated in accordance with the criteria already stated
in the ‘Financial assets’ section.
Fair value changes are reported differently depending on their designation (hedging or speculative) and the nature of the risk
hedged (fair value hedge or cash flow hedge).
For contracts designated for hedging purposes, the Group documents this relationship when the hedge is established. The
documentation incorporates the identification of the hedging instrument, the item or transaction hedged, the nature of the risk
hedged, the criteria used to ascertain the effectiveness of the hedging instrument as well as the risk. The hedge is considered
effective
when the projected change in fair value or in the cash flows of the
hedged instrument is offset by the change in fair value
or in the cash flows of the hedging instrument, and the net results fall within the range of 80% to 125%.
If
the instruments are not, or cannot be, designated as hedging
instruments, they must be considered “speculative”; in this case,
fair value changes are posted directly to the Income Statement.
In
the case of fair value hedges, changes in the fair value of the hedging
instrument and the hedged instrument are posted to the
Income
Statement regardless of the valuation criterion used for the hedged
instrument. In the case of cash flow hedges, the portion
of
the fair value change in the hedging instrument that is recognised as
an effective hedge is posted to shareholders' equity, while
the portion that is not effective is posted to the Income Statement.
Receivables and payables
A receivable is first reported at fair value on the date it is agreed.
After
initial reporting, receivables are valued at amortised cost. Payables
that fall due within normal contractual terms are initially
posted at fair value and later valued at amortised cost.
Trade receivables
If there is objective evidence that a trade receivable has suffered impairment, it must be adjusted down and the loss posted to
the
income statement; the write-down is allocated to the item ‘impairment
provisions’, as a direct contra item to the asset item.
The amount of the write-down must take into account recoverable cash flows, the related collection dates, future recovery
charges and expenses and the discount rate to be applied.
DeA Capital - Annual Financial Statements to 31 December 2014
97

Cash and cash equivalents
Cash and cash equivalents include cash at hand, demand deposits and short-term, highly liquid financial investments that are
readily convertible to cash and subject to a negligible risk of price variation. Their value is reported at fair value.
Held-for-sale assets
A
non-current asset or disposal group is classified as held for sale if
the carrying value will mainly be recovered from its sale or
disposal
instead of its ongoing use. In order for this to occur, the asset or
disposal group must be available for immediate sale in its
current
condition, and the sale must be highly likely. Assets meeting the
criteria to be classified as held-for-sale assets are valued at
the lower of carrying value and sales value adjusted for any related costs.
Treasury shares
Treasury
shares are not considered financial assets of the company that issued
the shares. The purchase and sales value of treasury
shares
is recorded as a change to shareholders' equity. No gain or loss is
reported in the income statement for the sale, purchase,
issue or cancellation of treasury shares.
Fair value reserve
The fair value reserve incorporates fair value changes to entries measured at fair value with a balancing entry in
shareholders' equity.
Warrants
Warrants issued by the Group, which do not meet the requirements either for being classified as share-based payments to
employees pursuant to IFRS 2 or as financial liabilities, are treated as the Group's equity instruments.
Put options on minority shareholdings
For put options that do not grant actual access to the economic benefits associated with owning the minority shareholdings,
the shares or shareholdings covered by the options are reported on the date control is acquired as “minority interests”; the
portion of profits and losses (and other changes in shareholders' equity) of the entity acquired is allocated to the minority
shareholding after the business combination. The minority shareholding is reversed on each reporting date and reclassified
as a financial liability at its fair value (equal to the present value of the option's exercise price) as if the acquisition had
occurred on that date. The difference between the fair value of the financial liability and the minority interest reversed on
the reporting date is recorded as an acquisition of minority shareholdings and reported under the Group's shareholders'
equity. The effect of discounting is not recorded separately. Any dividends paid to minority shareholders are posted to
shareholders' equity.
If
the option is not exercised, the minority interest is recognised in the
amount that would have been reported if the option had not
been recorded; the difference between the minority interest
recognised and the cancelled liability is recorded in the Group’s shareholders’ equity.
Provisions for risks and future liabilities
As necessary, the Group records provisions for risks and future liabilities when:
• it has a legal or implicit obligation to third parties resulting from a past event;
• it is likely that Group resources will be used to fulfil the obligation;
• a reliable estimate can be made of the amount of the obligation.
Provisions
are recorded based on the projected value and discounted as necessary
to present value if the time value is considerable.
Changes in estimates are recognised in the income statement of the period in which the change occurs.
Revenues and income
Service
revenues are recognised at the time the services are rendered based on
the progress of the activity on the reporting date.
Income from equity investments for dividends or for their full or partial sale is reported when the right to receive payment
is determined, with a balancing item (receivable) at the time of the sale or decision to distribute dividends by the entity
or appropriate body.
Interest is reported using the effective interest rate method.
98 DeA Capital - Annual Financial Statements to 31 December 2014

Employee benefits
Short-term employee benefits, whether in cash or in kind (meal vouchers) are reported in the income statement in the period when
work is performed.
Employee
benefits related to participation in a defined benefit plan are
determined by an independent actuary using the projected
unit credit method.
On 16 June 2011, the IASB published a revised version of IAS 19 “Employee Benefits”. Among other things, this document
modified the accounting rules of defined benefit plans (Post-employment benefits: defined benefit plans) and termination
benefits.
Specifically:
•
For “Post-employment benefits: defined benefit plans”, the option to
use the “corridor approach” to account for actuarial gains
and losses was eliminated. These must now be recognised in the Statement of Performance. The resulting remeasurement effect
cannot be recycled through P&L but should be accumulated as a separate account within equity. No other option is available.
Actuarial gains and losses include profits and losses of a technical nature due to changes in the actuarial assumptions adopted
and/or
the fact that experience may differ from the actuarial assumptions
adopted (e.g. staff turnover, early retirement, mortality,
change in the discount rate);
• Past service costs and the effects generated by curtailments and/or plan settlement (caused, for example, by a significant
reduction in the number of employees covered by the plan, changes to the plan’s terms and conditions) are recorded immediately
in the income statement under personnel costs;
• The interest cost (resulting from the discounting to present value process) and the expected returns on assets servicing the
plan are replaced by a net interest figure reported in the income statement under financial charges and calculated by applying
a
discount rate (based on the high-quality corporate bonds rate at the
end of the year) to the balance of the existing plan at the
beginning of the year.
Employee
benefits in respect of participation in a defined contribution plan
only relate to those plans under mandatory government
administration.
The payment of contributions fulfils the Group's obligation to its
employees. Thus, contributions are costs in the
period in which they are payable.
In the Group, benefits were provided in the form of stock options or share-based payments. This applies to all employees
eligible for stock option plans. The cost of these transactions is determined with reference to the fair value of the options
on the date allocation is made and is reported over the period from such date until the expiry date with a balancing entry in
shareholders' equity.
The cost of stock options for the Group's directors and contributors is determined in the same way.
Income tax
Current income taxes are determined and reported on the basis of a reasonable forecast of tax charges resulting from applying
the tax rates in effect in the various countries where Group companies operate to taxable income, and taking into account any
exemptions and tax credits to which such companies are entitled.
Deferred
tax liabilities are allocated for all temporary differences between the
carrying value of the assets and liabilities and the
corresponding amount for tax purposes.
Deferred
tax assets are recorded for all deductible temporary differences and
for tax assets and liabilities carried forward to the
extent
that it is likely there will be sufficient future taxable profit
against which the deductible temporary differences and the tax
assets and liabilities carried forward can be used.
Deferred
taxes are classified under non-current assets and liabilities and are
determined using tax rates expected to be applicable
under
the laws in the countries where the Group operates in the years when
the temporary differences will be realised or will expire.
The
carrying values of deferred tax assets are analysed periodically and
reduced if it is not likely that sufficient taxable income will
be generated against which the benefits resulting from such deferred assets can be used.
DeA Capital - Annual Financial Statements to 31 December 2014
99

Earnings per share
In accordance with IAS 33, basic earnings per share is determined as the ratio of net profit for the period attributable to
shareholders owning Parent Company shares to the weighted average number of shares outstanding during the period.
Treasury shares in the portfolio are, of course, not included in this calculation.
Diluted earnings per share is calculated by adjusting the weighted average number of shares outstanding for all potential
ordinary
shares resulting from the potential exercise of assigned stock options,
which may therefore result in a diluting effect.
C. Changes in accounting principles and the treatment of errors
Accounting principles are changed from one year to another only if the change is dictated by an accounting standard or if
it helps provide more reliable information or more complete reporting of the impact of transactions on the Group's assets,
operating result and cash flows.
Changes in accounting standards are applied retroactively with the impact reflected in shareholders' equity in the first of
the periods presented. Comparative reporting is adapted accordingly. The prospective approach is used only when it is not
practical to restate comparative reporting. The application of a new or amended accounting standard is recorded as required
by the standard itself.
If the standard does not specify transition methods, the change is reflected retrospectively, or if impractical, prospectively.
If there are significant errors, the same treatment dictated for changes in accounting principles is used. If there are minor
errors, corrections are posted to the income statement in the period when the error is discovered.
D. Use of estimates and assumptions in preparing the financial statements
The Company's management must make assessments, estimates and assumptions that affect the application of accounting
standards and the amounts of assets, liabilities, costs and revenues recorded in the financial statements. Estimates and
related assumptions are based on past experience and other factors deemed reasonable in the case concerned; these have
been used to estimate the carrying value of assets and liabilities that cannot be easily obtained from other sources.
These estimates and assumptions are reviewed regularly. Any changes resulting from revisions to accounting estimates are
recorded in the period when the revision is made if such revisions only affect that period. If the revision affects current and
future periods, the change is recorded in the period in which the revision is made and in related future periods.
Financial statement balances are reported and valued using the valuation criteria described above. At times, the application
of these criteria involves the use of estimates that may have a significant impact on amounts reported in the financial
statements. Estimates and related assumptions are based on past experience and factors deemed reasonable in the case
concerned; these are used to estimate the carrying value of assets and liabilities that cannot be easily obtained from other
sources. However, since these are estimates, the results obtained should not necessarily be considered definitive.
With the understanding that the use of reasonable estimates is an essential part of preparing financial statements, the items
where the use of estimates is most prevalent are stated below:
• valuation of financial assets not listed in active markets;
• valuation of financial assets listed in active markets but considered illiquid on the reference market;
• valuation of equity investments.
The process described above is made particularly complicated by the unusual levels of volatility in the current macroeconomic
and market environment, which affect financial indicators that have a bearing on the above valuations.
An estimate may be adjusted as a result of changes in the circumstances on which it was based, or as a result of new
information. Any change in the estimate is applied prospectively and has an impact on the income statement in the period in
which the change occurred and potentially on income statements in future periods.
100 DeA Capital - Annual Financial Statements to 31 December 2014

As allowed by IAS/IFRS, the preparation of the Consolidated Financial Statements of DeA Capital Group required the use of
significant estimates by the Company's management, especially with regard to the valuations of the investment portfolio
(equity investments and funds).
These valuations are calculated by directors based on their best judgement and estimation using the knowledge and evidence
available at the time the consolidated financial statements are prepared. However, due to objective difficulties in making
assessments and the lack of a liquid market, the values assigned to such assets could differ, perhaps and in some cases
significantly, from those that could be obtained when the assets are sold.
DeA Capital - Annual Financial Statements to 31 December 2014
101

Statement of financial position
Non-current assets
1 - Intangible and tangible assets
1a - Goodwill
Changes in goodwill are shown in the table below:
Balance at
Balance at
(EUR thousand)
1.1.2014
Acquisitions Impairment
31.12.2014
Goodwill
166,315
48
0
166,363
Goodwill, which amounted to EUR 166,363 thousand at 31 December 2014 (EUR 166,315 thousand at 31 December 2013),
mainly relates to the acquisition of FARE Holding (now DeA Capital Real Estate) for EUR 27,520 thousand, the acquisition of
IDeA Capital Funds SGR for EUR 40,574 thousand and the acquisition of IFIM/FIMIT SGR (now IDeA FIMIT SGR) for EUR 96,599
thousand.
The full goodwill method was used to record the minority interests of the companies acquired during 2011 (FIMIT SGR and IFIM).
This requires minority interests to be recorded at fair value.
Impairment tests on goodwill
Pursuant to IAS 36, goodwill is not subject to amortisation, and is tested for impairment at least annually.
In
order to carry out impairment testing on the goodwill of its cash
generating units (CGUs), the DeA Capital Group allocates the
goodwill to the relevant CGUs, identified as IDeA FIMIT SGR (real estate fund management) and IDeA Capital Funds SGR, which
represent the minimum level of monitoring that the DeA Capital Group undertakes for management control purposes consistent
with DeA Capital’s strategic vision.
The redefinition of the IDeA Alternative Investments CGU following its merger into the Parent Company (in 2011) meant that a
new CGU had to be defined, namely IDeA Capital Funds SGR. The previous goodwill of the IDeA Alternative Investments CGU
was allocated in its entirety to the new CGU.
Impairment testing consists of comparing the recoverable amount of each CGU with the carrying amount of goodwill and the
other assets attributed to each CGU.
In the case of CGUs that are not wholly controlled, goodwill is reported on a notional basis, which also includes the portion of
goodwill that relates to minorities, using the grossing up method.
The carrying value of the CGU is calculated using the same criterion as that used to determine the recoverable value of the CGU.
The main assumptions used in the impairment test calculations, together with the results, are set out below.
Impairment testing was carried out on the IDeA FIMIT SGR CGU, with a carrying amount of EUR 49.9 million, using the sum of
the parts model by determining the value in use, calculated as the sum of (i) the present value of dividend flows (DDM method)
expected from IDeA FIMIT SGR and (ii) the present value of the carried interest flows expected from the same company (DCF
method), both for the specific period covered by the forecasts (2015-2017) and for those in future (using a projected terminal
value based on normalised cash flows).
A number of assumptions were used in determining these flows, including estimates of future increases in revenues, based on
expected trends in managed assets, EBITDA and net income, or in the case of carried interest, on the basis of return projections
(IRR) made by the company for the various funds under management.
102 DeA Capital - Annual Financial Statements to 31 December 2014
The valuation was based on a cost of capital of between 10.4% and 11.7%, depending on (i) the period of the flows (2015-2017
or later) and (ii) the nature of these flows (dividends from the asset management company or carried interest from the managed
funds), supplemented by a terminal value based on a growth assumption (g) of 1.0%.
With reference to the CGU, note that the recoverable amount is higher than the carrying amount.
Sensitivity
analysis performed on the most significant variables in terms of
sensitivity to the recoverable value of IDeA Capital
Funds
SGR, i.e. the risk-free rate and the rate of return for the managed
funds used, leads to a potential change in the carrying
value of EUR -2.1/+2.5 million (for changes of +0.5% and -0.5% in the risk-free rate) and EUR -1.8/+1.9 million (for changes of
-1.5% and +1.5% in the expected IRR rate on the managed funds).
Similarly, impairment testing was carried out on the IDeA FIMIT SGR CGU, with a carrying amount of EUR 198.0 million, using
the sum of the parts model by determining the value in use, calculated as the sum of (i) the present value of dividend flows
(DDM method) expected from IDeA FIMIT SGR and (ii) the present value of the carried interest flows expected from the same
company (DCF method), both for the specific period covered by the forecasts (2015-2017) and for those in future (using a
projected terminal value based on normalised cash flows).
A number of assumptions were used in determining these flows, including estimates of future increases in revenues, based on
expected trends in managed assets, EBITDA and net income, or in the case of carried interest, on the basis of return projections
made by the company for the various funds under management.
The valuation was based on a cost of capital of +9.5% plus a terminal value based on growth (g) assumptions of +1.0%.
With reference to the CGU, note that the recoverable amount is higher than the carrying amount.
Sensitivity analysis performed on the most significant variables in terms of sensitivity to the recoverable value of IDeA FIMIT
SGR, i.e. the risk-free rate and the rate of growth (g) used, leads to a potential change in the company’s overall value of EUR
-8.5/+9.7 million (for changes of +0.5% and -0.5% in the discount rate) and EUR -7.1/+8.0 million (for changes of -0.5% and
+0.5% in the rate of growth (g)).
IDeA Capital Funds SGR and IDeA FIMIT SGR’s business plans were approved in the respective Board Meetings.
It has to be highlighted that the above mentioned impairment test took place with the support of renowned extrernal experts.
1b - Intangible assets
Changes in intangible assets are shown in the tables below:
Cum. amort.
Net
Cum. amort.
Historical
& write-
carrying
Historical
& write-
Net carrying
cost at
downs at
value at
cost at
downs at
value at
(EUR thousand)
1.1.14
1.1.14
1.1.14
31.12.14
31.12.14
31.12.14
Concessions, licences
and trademarks
4,967
(3,181)
1,786
5,439
(4,180)
1,259
Software expenses
259
(82)
177
400
(138)
262
Development expenses
229
(203)
26
229
(220)
9
Other intangible assets
122,853
(46,379)
76,474
122,850
(61,032)
61,818
Total
128,308
(49,845)
78,463
128,918
(65,570)
63,348
Balance at
Balance at
(EUR thousand)
1.1.2014 Acquisitions
Amort. Write-downs Decreases
31.12.2014
Concessions, licences
and trademarks
1,786
475
(1,002)
0
0
1,259
Software expenses
177
141
(56)
0
0
262
Development expenses
26
0
(17)
0
0
9
Other intangible assets
76,474
0
(9,756)
(4,900)
0
61,818
Total
78,463
616
(10,831)
(4,900)
0
63,348
DeA Capital - Annual Financial Statements to 31 December 2014
103
Increases
in the items ‘concessions, licences and trademarks’ and ‘software
costs’ relate to purchases of software usage licences
and the related development costs.
The cost of other intangible assets mainly relate to:
• Customer relationships arising from the allocation of the residual value of FIMIT SGR on the date of the (inverse) merger into
FARE
SGR with the recognition of intangible assets identified as customer
relationships and intangible assets related to variable
commissions that were valued at EUR 38,573 thousand and EUR 68,688 thousand respectively. This value is based on the
discounting of fixed management fees (for customer relationships) and variable fees calculated net of directly applicable costs
on the basis of the most recent business plans of the funds under management.
• Customer relationships, totalling EUR 14,156 thousand, arising from the allocation of the discounted value of commission flows
generated by the funds under management of IDeA Capital Funds SGR, net of management costs, based on the business plans
of the funds under management.
Following the revision of the business plans of the funds that make up the intangible assets from variable commissions, in order
to adjust the value of assets to fair value, intangible assets arising from variable commissions were written down on the income
statement in the amount of EUR 4,900 thousand.
Except
for intangible assets involving rights connected with final variable
commissions, intangible assets with a finite useful life
are amortised on a straight-line basis over their useful life.
The amortisation method used for rights connected with final variable commissions reflects changes in future economic benefits
associated with the recognition of the related revenues.
1c - Tangible assets
Changes in tangible assets are shown in the tables below:
Cum. amort.
Cum. amort.
Historical
& write-
Net carrying
Historical
& write-
Net carrying
cost at
downs at
value at
cost at
downs at
value at
(EUR thousand)
1.1.14
1.1.14
1.1.14
31.12.14
31.12.14
31.12.14
Leasehold improvements
3,774
(474)
3,300
3,714
(1,020)
2,694
Furniture and fixtures
1,777
(693)
1,084
1,729
(836)
893
Computer and office equipment
1,336
(1,070)
266
1,158
(952)
206
Company vehicles
475
(310)
165
475
(389)
86
Plant
119
(95)
24
39
(20)
19
Other assets
389
(373)
16
389
(379)
10
Total
7,870
(3,015)
4,855
7,504
(3,596)
3,908
Balance at
Balance at
(EUR thousand)
1.1.2014
Acquisitions
Amort.
Write-downs Decreases
31.12.2014
Leasehold improvements
3,300
52
(564)
(16)
(78)
2,694
Furniture and fixtures
1,084
30
(228)
14
(7)
893
Computer and office equipment
266
52
(110)
2
(4)
206
Company vehicles
165
1
(80)
0
0
86
Plant
24
0
(5)
0
0
19
Other assets
16
0
(6)
0
0
10
Total
4,855
135
(993)
0
(89)
3,908
The item ‘Leasehold improvements’, totalling EUR 2,694 thousand, mainly relates to improvements made to the building at Via
Brera 21 in Milan, which was leased to the DeA Capital Group from 2013.
Depreciation of tangible assets is calculated on a straight-line basis, according to the estimated useful life of the asset.
The depreciation rates used in the financial year were 20% for specific plant assets, 12% for furniture and furnishings, 20% for
electronic office machines, 20% for company vehicles and 15% for leasehold improvements.
104 DeA Capital - Annual Financial Statements to 31 December 2014
2 - Financial investments
Financial investments in companies and funds are the Group's typical activities. These investments fell from EUR 653,435
thousand at 31 December 2013 to EUR 516,442 thousand at end-2014.
2a - Investments in associates
This item totalled EUR 19,066 thousand at 31 December 2014 (EUR 240,084 thousand at end-2013).
On 1 October 2014, Santé and Santé Dévéloppement Europe (SDE) sold their stake in Générale de Santé at a price of EUR 16.00
per share after cashing in the dividend of EUR 0.75 per share due to them. Santé and SDE received a total of approximately
EUR 788 million, including the dividend, which will be used partly to repay the two companies' financial debt (around EUR 407
million,
of which EUR 31.4 million to the DeA Capital Group to repay the
existing quasi-equity loan) and partly to distribute cash
to shareholders (some EUR 381 million).
The net proceeds for the DeA Capital Group from the transaction amounted to EUR 164.1 million (EUR 195.5 million taking into
account the repayment of the loan granted to Santé).
In addition, the IDeA OF I fund was fully consolidated from 1 January 2014 in accordance with the new IFRS 10.
This item relates to the following assets:
- investment in Sigla Luxembourg (parent company of the Sigla Group), which was recorded at end-2013 at EUR 12,084
thousand, and reported at EUR 11,201 thousand in the consolidated financial statements to 31 December 2014.
The change compared with 31 December 2013 is mainly related to the impact of the result for the period.
- The units in AVA were valued at around EUR 7,865 thousand in the Consolidated Financial Statements for the Year Ending 31
December 2014 compared with EUR 6,647 thousand at 31 December 2013; the change compared with 2014 was due to the
result for the period.
The table below provides details of the investments held in associates at 31 December 2014 by business:
Alternative
Private Equity
Asset
(EUR thousand)
Investment Management
Total
Sigla
11.2
0.0
11.2
AVA Fund
2.6
5.3
7.9
Total
13.8
5.3
19.1
The table below summarises details of Sigla’s financial information, based on the reporting package prepared in accordance with
the accounting principles used by the DeA Capital Group at 31 December 2014:
Sigla Group
(EUR thousand)
2014
2013
Revenues
17,886
16,937
Net profit/(loss) for the year
(2,244)
(607)
Other profit/(loss), net of tax effect
6
40
Total comprehensive profit/(loss) for the year
(2,238)
(567)
Total comprehensive profit/(loss) for the year attributable to minorities
(1,354)
(337)
Total comprehensive profit/(loss) for the year attributable to Group
(884)
(230)
DeA Capital - Annual Financial Statements to 31 December 2014
105
(EUR thousand)
31.12.2014
31.12.2013
Current assets
55,591
67,423
Non-current assets
15,822
15,962
Current liabilities
(42,507)
(52,625)
Non-current liabilities
(1,844)
(1,562)
Net assets
27,062
29,198
Net assets attributable to minorities
15,861
17,113
Net assets attributable to the Group
11,201
11,885
(EUR thousand)
31.12.2014
31.12.2013
Net initial assets attributable to the Group
12,085
12,315
Total comprehensive profit/(loss) for the year attributable to Group
(884)
(230)
Dividends received in the period
0
0
Net final assets attributable to minorities
11,201
12,085
Goodwill
0
0
Book value of associate company
11,201
12,085
Dividendi pagati a Terzi nel periodo
0
0
2b - Shareholdings held by funds
At 31 December 2014, the DeA Capital Group was a shareholder, through the IDeA OF I fund, in Giochi Preziosi, Manutencoop,
Grandi Navi Veloci, Euticals, Telit, Elemaster, Talgo, Corin and Iacobucci.
This item, which totalled EUR 111,014 thousand at 31 December 2014 (EUR 114,225 thousand at 31 December 2013), relates to
the assets set out below:
(EUR million)
31 December 2014
Portfolio investments
Giochi Preziosi
10,0
Manutencoop Facility Management
18,9
Grandi Navi Veloci
4,5
Lauro Cinquantasette (Euticals)
11,8
Telit Communications
17,5
Elemaster
8,5
Available-for-sale investments
71,2
Iacobucci HF Electronics
12,0
Pegaso Transportation Investments (Talgo)
15,0
2IL Orthopaedics LTD (Corin)
12,8
Investments in associates and JVs recognised on income statement
39,8
Total Portfolio Investments
111,0
106 DeA Capital - Annual Financial Statements to 31 December 2014
2c - Investments in other companies - available for sale
At 31 December 2014, the DeA Capital Group was a minority shareholder of Kenan Investments (the indirect parent company
of Migros), Stepstone, Harvip Investimenti, two US companies operating in the biotech and printed electronics sectors, TLcom
Capital LLP (management company under English UK law) and TLcom II Founder Partner SLP (limited partnership under English
UK law).
At 31 December 2014, the item totalled EUR 209,320 thousand compared with EUR 132,536 thousand at 31 December 2013.
The table below provides details of equity investments in other companies at 31 December 2014 by area of activity:
Alternative
Private Equity
Asset
(EUR million)
Investment Management
Total
Kenan Investments
209.1
0.0
209.1
Minority interests
0.2
0.0
0.2
Total
209.3
0.0
209.3
The shareholding in Kenan Investments (the indirect parent company of Migros) was recorded in the Consolidated Financial
Statements for the Year Ending 31 December 2014 at a value of EUR 209,136 thousand (compared with EUR 132,351 thousand
at 31 December 2013).
This valuation is based on the percentage DeA Capital owns in Kenan Investments/Moonlight Capital and a Migros share price of:
(i)
TRY 26.00 for the stake in Migros that is the subject of the
transaction with Anadolu (and therefore both the 40.25% of Migros
shares being sold immediately and the 9.75% of its shares subject to put and call options agreed by the parties);
(ii) TRY 22.75 (the market price on 31 December 2014) for the remaining stake (30.5% of Migros capital).
The increase of EUR 76,785 thousand versus 31 December 2013 was due to the above-mentioned rise in the value of Migros
shares (compared with TRY 16.00 per share at 31 December 2013) and the appreciation of the Turkish lira against the euro (2.83
TRY/EUR at 31 December 2014 versus 2.97 TRY/EUR at 31 December 2013).
The
effect on the DeA Capital Group’s NAV of this change in fair value was
partially offset by the estimated carried interest to be
paid, based on the total capital gain, of EUR -11.4 million (compared with no impact at 31 December 2013).
The
value of minor equity investments relate to a minority shareholding in
Harvip. The DeA Capital Group is also a shareholder in
three companies - Elixir Pharmaceuticals Inc., Kovio Inc. and Stepstone - which are not included in the investment portfolio as
they are either dormant or in liquidation, and have zero value.
Registered
Company
office
Business sector
% holding
Elixir Pharmaceuticals Inc.
USA
Biotech
1.30
Harvip Investimenti S.p.A.
Italy Distressed real estate and other investments
19.18
Kovio Inc.
USA
Printed circuitry
0.42
Stepstone Acquisition Sàrl
Luxembourg
Special opportunities
36.72
DeA Capital - Annual Financial Statements to 31 December 2014
107

2d - Available-for-sale funds
This item relates to investments in units of three funds of funds (IDeA I FoF and ICF III), two theme funds (IDeA EESS and
IDeA ToI), seven real estate funds and 11 venture capital funds, totalling approximately EUR 176,736 thousand at end-2014,
compared with EUR 166,260 thousand at end-2013.
The table below shows changes to the funds during 2014.
Increases
Decreases
Balance at
(Capital
(Capital
Fair value Translation Balance at
(EUR thousand)
1.1.2014
call) distribution) Impairment
adjustment
effect
31.12.2014
Venture capital funds
10,682
0
(193)
(323)
(1,424)
838
9,580
IDeA I FoF
94,704
3,519
(21,424)
0
16,677
0
93,476
ICF II
23,788
7,304
(2,907)
0
7,069
0
35,254
ICF III Core
0
274
0
0
(3)
0
271
ICF III Credit & Distressed
0
977
0
0
38
0
1,015
ICF III Emerging Markets
0
525
0
0
(71)
0
454
IDeA EESS
2,993
2,270
0
(933)
0
0
4,330
Taste of Italy
0
91
0
0
(88)
0
3
IDeA FIMIT SGR Funds
34,093
0
(4,208)
(516)
2,984
0
32,353
Total funds
166,260
14,960
(28,732)
(1,772)
25,182
838
176,736
Units in venture capital funds are valued at around EUR 9,580 thousand in the consolidated financial statements to 31 December
2014 (EUR 10,682 thousand at end-2013).
The overall change in the investments is mainly due to capital reimbursements from these funds of EUR 193 thousand, a
decrease in fair value (and related exchange rate effects) of EUR 586 thousand, impairment (and related exchange rate effects)
of certain funds totalling approximately EUR 323 thousand.
Over 2014, the Company received income distributions of EUR 298 thousand and capital reimbursements of EUR 24,524
thousand.
The fair value measurement of investments in venture capital funds at 31 December 2014, carried out based on the information
and documents received from the funds, as well as other available information, meant that the amount had to be written down
by EUR 323 thousand; the significant reduction to below cost was considered clear evidence of impairment.
Units in IdeA I FoF are valued at around EUR 93,476 thousand in the consolidated financial statements to 31 December 2014
(EUR 94,704 thousand at end-2013).
The change in the carrying value compared with 31 December 2013 was due to contributions made for capital calls totalling
EUR 3,519 thousand, capital reimbursements of EUR 21,424 thousand and a net increase in fair value of around EUR 16,677
thousand.
Units in ICF II are valued at around EUR 35,254 thousand in the Consolidated Financial Statements for the Year Ending
31 December 2014 (EUR 23,788 thousand at 31 December 2013).
The change in the carrying value compared with 31 December 2013 was due to contributions made for capital calls totalling EUR
7,304 thousand, capital reimbursements of EUR 2,907 thousand and a net increase in fair value of around EUR 7,069 thousand.
Units in IDeA EESS are valued at around EUR 4,330 thousand in the Consolidated Financial Statements for the Year Ending
31 December 2014 (EUR 2,993 thousand at 31 December 2013).
108 DeA Capital - Annual Financial Statements to 31 December 2014
The change in the carrying value compared with 31 December 2013 was due to contributions made for capital calls totalling EUR
2,270 thousand and impairment of around EUR 933 thousand.
The units in ICF III, which were subscribed to in 2014, are valued at around EUR 1,740 thousand in the Consolidated Financial
Statements for the Year Ending 31 December 2014 due to contributions made for capital calls and the decrease in fair value due
to the fact that the fund is still in the start-up phase.
The units in IDeA Taste of Italy, which were subscribed to in 2014, are valued at close to zero in the Consolidated Financial
Statements for the Year Ending 31 December 2014 due to contributions made for capital calls and the decrease in fair value due
to the fact that the fund is still in the start-up phase.
The financial assets related to units of funds managed by IDeA FIMIT SGR are considered long-term investments. This item
includes:
• Mandatory investments (as stipulated by the Bank of Italy Regulation of 14 April 2005, amended and supplemented by the
Bank of Italy Regulation of 8 May 2012, as amended) in managed funds that are not reserved for qualified investors. The latter
are
to be held in the portfolio until the funds' maturity date. However,
they were not classified as ‘held-to-maturity assets’ since
they are variable-rate financial instruments. It was therefore decided to record them in this ‘residual’ category in accordance
with IAS 39, which specifies that they should be measured at fair value with a balancing entry in an appropriate unavailable
reserve pursuant to Legislative Decree 38/2005;
• Optional investments in managed funds that may or may not be reserved for qualified investors.
Units in these funds are valued at around EUR 32,353 thousand in the Consolidated Financial Statements for the Year Ending 31
December 2014 (EUR 34,093 thousand at 31 December 2013).
The change versus end-2013 is due to capital reimbursements received of EUR 4,208 thousand, impairment of around EUR 516
thousand and a net increase in fair value of approximately EUR 2,984 thousand.
Note
that to secure the loan made by Banca Intermobiliare, IDeA FIMIT SGR
established a lien in favour of this bank consisting of
600 units in the Omicron Plus fund.
The table below provides a breakdown of the funds in the portfolio at 31 December 2014 by area of activity:
Alternative
Private Equity
Asset
(EUR million)
Investment Management
Total
Venture capital funds
9,6
0,0
9,6
IDeA I FoF
93,5
0,0
93,5
ICF II
35,3
0,0
35,3
ICF III
1,7
0,0
1,7
IDeA EESS
4,3
0,0
4,3
IDeA FIMIT SGR Funds
0,0
32,3
32,3
Total funds
144,4
32,3
176,7
2e - Other available-for-sale financial assets
The item totalled EUR 306 thousand (EUR 330 thousand at 31 December 2013) and mainly relates to the shareholdings held by
IRE in Beni Immobili Gestiti S.p.A. (0.25%) and in AEDES BPM Real Estate SGR S.p.A. (5.0%).
DeA Capital - Annual Financial Statements to 31 December 2014
109

3 - Other non-current assets
3a - Deferred tax assets
The balance on the item ,deferred tax assets, totalled EUR 5,039 thousand and comprises the value of deferred tax assets minus
deferred tax liabilities, where they may be offset.
Deferred tax assets relating to the Parent Company of EUR 8,402 thousand were fully offset against deferred tax liabilities.
The changes to deferred tax assets and liabilities during the year, broken down by type, are analysed below:
Posted to
Changes in
Balance at the income
Recognised
the basis of Compensation/ Balance at
(EUR thousand)
1.1.2014
statement
in equity
consolidation
other changes
31.12.2014
Deferred tax assets for:
-personnel costs
511
131
0
0
265
907
- other
1,419
955
(214)
0
1,972
4,132
Total deferred tax assets
1,930
1,086
(214)
0
2,237
5,039
Deferred tax liabilities for:
- available-for-sale financial
assets
(4,797)
12
(6,862)
2,189
(9,458)
- discounting of end-of-service
payment fund
53
1
0
0
(3)
51
- intangible fixed assets
(17,005)
2,360
0
0
(3,128)
(17,773)
Total deferred tax liabilities
(21,749)
2,373
(6,862)
0
(942)
(27,180)
Losses carried forward
available for offset against
future taxable profits
2,939
5,840
0
(1,295)
7,484
Total deferred tax assets
2,657
5,039
Total deferred tax liabilities
(19,537)
(19,696)
The deferred tax liabilities of IDeA FIMIT SGR, amounting to EUR 16,005 thousand, mainly comprise the balancing entry for
deferred tax assets relating to variable commissions recorded under intangible assets. The balance is lower than at end-2013
due to the release of EUR 1,620 thousand on the income statement following the write-down of intangible assets from variable
commissions of EUR 4,900 thousand.
As
required by IFRS 3 (Business Combinations), the company recorded a
deferred tax liability for the assets identified at the date
of acquisition.
No deferred tax assets were allocated against the significant tax losses of DeA Capital S.p.A. (around EUR 108,074 thousand, to
be reported without limitation and around EUR 879 thousand to be used with limitation). This was because there was insufficient
information for the Group to believe that sufficient taxable income would be generated in future periods against which such tax
losses could be recovered.
Deferred taxes were calculated using the liability method based on the temporary differences at the reporting date between the
tax amounts used as a reference for the assets and liabilities and the amounts reported in the financial statements.
3b - Tax receivables relating to the tax consolidation scheme entered into by the parent
companies
This item totalled EUR 546 thousand at 31 December 2014 (EUR 2,984 thousand at 31 December 2013) and relates to the
receivable from the Parent Company De Agostini S.p.A. for joining the tax consolidation scheme.
110 DeA Capital - Annual Financial Statements to 31 December 2014

3c - Other non-current assets
This item totalled EUR 30,495 thousand at 31 December 2014, compared with EUR 32,468 thousand at 31 December 2013, and
mainly relates to:
• The receivable from Beta Immobiliare fund concerning the final variable commission, in the amount of EUR 23,184 thousand.
The calculation was done pursuant to the provisions of the operating regulations of the Beta Immobiliare fund, taking into
account the NAV indicated in the management report at 31 December 2014. This receivable corresponds to the portion of the
overperformance commission accrued since the beginning of the fund's operations that the asset management fund will receive
when liquidated, but only if certain conditions are met;
• a receivable of EUR 7,023 thousand in favour of the IDeA OF I fund for the sale of 1% of Manutencoop.
4 - Current assets
4a - Trade receivables
Receivables amounted to EUR 29,039 thousand, compared with EUR 21,078 thousand at 31 December 2013, and mainly included
receivables from customers (EUR 28,841 thousand). These related mainly to the balances of IRE (EUR 16,648 million) and IDeA
FIMIT SGR (EUR 11,998 thousand). The latter amount mainly relates to receivables from managed funds for commission due but
not yet received.
Receivables from customers due to IRE include EUR 8,297 thousand relating to the re-invoicing of expenses incurred by the
company in its own name but on behalf of funds managed by IDeA FIMIT SGR. This activity was carried out by the company
by virtue of a mandate without appointed representation, as provided for in the framework agreement signed by IRE and IDeA
FIMIT SGR on 12 December 2012.
The item ‘Transactions with Related Parties’ includes EUR 147 thousand from De Agostini S.p.A. for the agreement to sublet
rented premises and the reimbursement of costs associated with said agreement.
4b - Available-for-sale financial assets
At 31 December 2014, this item totalled EUR 5,080 thousand, compared with EUR 5,464 thousand at 31 December 2013, and
relates to the portfolio of government securities and corporate bonds held by IDeA Capital Funds SGR.
4c - Financial receivables
At 31 December 2014, this item totalled EUR 2,678 thousand and relates mainly to an agreement for a 12-month revolving loan,
of up to EUR 5 million, in favour of Sigla S.r.l., a wholly-owned subsidiary of associate company Sigla Luxembourg S.A., for EUR
1,699 million.
4d - Tax receivables relating to the tax consolidation scheme entered into by the parent
companies
This item totalled EUR 3,533 thousand at 31 December 2014 (EUR 3,467 thousand at 31 December 2013) and relates to the
receivable from the Parent Company De Agostini S.p.A. for joining the tax consolidation scheme.
DeA Capital S.p.A., IDeA Capital Funds SGR and DeA Capital Real Estate have adopted the national tax consolidation scheme of
the
De Agostini Group (the Group headed by De Agostini S.p.A., formerly
B&D Holding di Marco Drago e C. S.a.p.a.). This option
was exercised jointly by each company and De Agostini S.p.A. by signing the “Regulation for participation in the national tax
consolidation scheme for companies in the De Agostini Group” and notifying the tax authorities of this option pursuant to the
procedures and terms and conditions set out by law. The option is irrevocable unless the requirements for applying the scheme
are not met.
The option is irrevocable for DeA Capital S.p.A. for the three-year period 2014-2016, for IDeA Capital Funds SGR for the three-
year period 2012-2014 and for DeA Capital Real Estate for the three-year period 2013-2015.
DeA Capital - Annual Financial Statements to 31 December 2014
111

4e - Other tax receivables
At 31 December 2014, this item totalled EUR 2,892 thousand, compared with EUR 4,912 thousand at 31 December 2013. It
mainly includes:
• a receivable due to IDeA FIMIT SGR of EUR 1,541 thousand deriving from advance payments of IRES/IRAP during the year
(amounting to EUR 5,145 thousand and EUR 1,835 thousand respectively), net of provisions for potential taxes (amounting to
EUR 3,861 thousand EUR 1,578 thousand respectively);
• a receivable arising from an application for an IRES refund from the Parent Company due to non-deduction of IRAP relating to
personnel costs for 2010/2011, of EUR 93 thousand;
• advance payments made in relation to foreign direct and indirect taxes in Luxembourg for EUR 191 thousand.
4f - Other receivables
The item, which totalled EUR 18,591 thousand at 31 December 2014 (EUR 18,416 thousand at 31 December 2013), includes
the receivable of the IDeA FIMIT Sviluppo fund of EUR 15,193 thousand and receivables for deposits, advances to suppliers and
prepaid expenses.
The IDeA FIMIT Sviluppo fund began its activities on 20 December 2013 by signing a framework agreement that defines the
terms and conditions and procedures of the initial investment planned for the fund, a development project in an area located in
Marino (the “Area EcoVillage”), totalling EUR 115 million.
On
the date it launched its activities, 600 class A units were issued,
with a nominal value of EUR 25,000, following cash payments
made, in equal measure, by the two subscribers, IDeA FIMIT SGR S.p.A. and De Agostini Invest S.A. On the same date, the fund
also
paid the company EcoVillage Tre S.r.l., EUR 14.9 million by way of a
deposit for the future purchase of the fund’s assets in
the Area EcoVillage.
4g - Cash and cash equivalents
This item, which totalled EUR 55,583 thousand at 31 December 2014 (EUR 26,396 thousand at the end of the previous year)
comprises bank deposits and cash, including interest accrued to 31 December 2013.
Please see the consolidated cash flow statement for further information on changes to this item.
The item ‘cash and cash equivalents’ relates to cash balances and bank deposits in the name of Group companies.
Cash deposited at banks accrues interest at floating rates, based on the prevailing overnight, 1-2-week and 1-3-month interest
rates.
5 - Shareholders' equity
At 31 December 2014, Group shareholders’ equity was approximately EUR 653,513 thousand, compared with EUR 629,489
thousand at 31 December 2013.
The increase of about EUR 24,024 thousand in Group shareholders' equity in 2014 was mainly due to the reasons already
discussed in the Statement of Performance - IAS 1 (EUR +30,089 thousand) and to the impact of the plan to purchase treasury
shares (EUR -3,720 thousand).
The main changes in shareholders’ equity are described in more detail in the relevant table of changes included in the
Consolidated Financial Statements.
5a - Share capital
The share capital (fully subscribed and paid up) totalled EUR 306,612,100, represented by 306,612,100 shares (of which
34,985,736 treasury shares) with a nominal value of EUR 1 each.
Given that the nominal value of the above-mentioned treasury shares held at 31 December 2014 is deducted from total share
capital, share capital of EUR 271,626,364 was reported in the Financial Statements.
112 DeA Capital - Annual Financial Statements to 31 December 2014
Changes in share capital are shown in the table below:
31.12.2014
31.12.2013
(EUR thousand)
No. of shares
amount
No. of shares
amount
Share capital
306,612,100
306,612
306,612,100
306,612
of which: Own shares
(34,985,736)
(34,986)
(32,637,004)
(32,637)
Share capital (excluding own shares)
271,626,364
271,626
273,975,096
273,975
The table below shows a reconciliation of the shares outstanding:
Own shares in
Shares issued
portfolio Shares in issue
Shares at 31 December 2013
306,612,100
(32,637,004)
273,975,096
Changes in 2014
Share capital increase
0
0
0
Own shares purchased
0
(2,348,732)
(2,348,732)
Own shares sold
0
0
0
Own shares disposed of
0
0
0
Used for stock option plan
0
0
0
Shares issued for stock options
0
0
0
Shares at 31 December 2014
306,612,100
(34,985,736)
271,626,364
5b - Share premium reserve
The item in question fell from EUR 386,198 thousand on 31 December 2013 to EUR 384,827 thousand at 31 December 2014,
due to the posting to this reserve of the purchase of treasury shares (EUR 1,371 thousand).
5c - Legal reserve
This reserve, which was unchanged compared with the end of 2013, totalled EUR 61,322 thousand at 31 December 2014.
5d - Fair value reserve
The fair value reserve at 31 December 2014 was positive at EUR 116,415 thousand (positive at EUR 28,725 thousand at
31 December 2013) and comprises the following items:
Balance at
Fair value
Balance at
(EUR thousand)
1.1.2014
adjustment
Tax effect
31.12.2014
Direct investments/equity investments
12,628
72,150
0
84,778
Venture capital and other funds
14,599
23,022
(6,968)
30,653
Reserve for IFRS first-time adoption and
other reserves
1,498
(588)
74
984
Total
28,725
94,584
(6,894)
116,415
5e - Other reserves
Other reserves totalled EUR -11,243 thousand at 31 December 2014 (EUR -8,898 thousand at 31 December 2013) and are made
up of:
- a reserve for stock option costs totalling EUR 1,034 thousand;
-
a reserve for the sale of option rights, totalling EUR 413 thousand
(these originated in the previous year from the sale of the
remaining option rights to subscribe to a capital increase that had not been exercised by the shareholders, which were sold by
the Company);
- other reserves of EUR -9,247 thousand relating to the associate GDS, which was sold in October 2014;
- other reserves of EUR -3,443 thousand (including EUR 1,968 million for the purchase of a 13.3% shareholding in Innovation
Real Estate from minority shareholder Emanuele Caniggia).
DeA Capital - Annual Financial Statements to 31 December 2014
113
5f - Retained earnings (losses) carried forward
This item totalled EUR -111,833 thousand at 31 December 2014, compared with EUR -80,703 thousand at 31 December
2013. The overall decrease of EUR 31,130 thousand was due to the allocation of profits for 2013.
5g - Profit (loss) for the year
The loss reported for the year of EUR -57,601 thousand is the consolidated loss attributable to the Group for 2014 (EUR -31,130
thousand at 31 December 2013).
5h - Minority interests
This item, which totalled EUR 173,109 thousand at 31 December 2014 (EUR 177,070 thousand at 31 December 2013) relates to
the minority interest in shareholders' equity resulting from the line-by-line consolidation of IDeA FIMIT SGR and the IDeA FIMIT
Sviluppo and IDeA OF I funds.
The table below summarises details of the financial information of IDeA FIMIT SGR and IDeA OF I, before elimination of the
intercompany relationships with the Group’s other companies, as at 31 December 2014.
IDeA FIMIT SGR
IDeA OF I
(EUR thousand)
2014
2013
2014
2013
Alternative Asset Management fees
54,116
64,573
0
0
Net profit/(loss) for the year
4,387
1,159
2,821
(7,919)
Profit/(loss) attributable to minorities
83
(2,599)
1,495
(4,198)
Other profit/(loss), net of tax effect
1,231
1,947
(30)
1,706
Total comprehensive profit/(loss) for the year
5,618
3,106
2,791
(6,213)
Total comprehensive profit/(loss) for the year
attributable to minorities
522
(1,904)
2,975
(3,294)
(EUR thousand)
31.12.2014
31.12.2013
31.12.2014
31.12.2013
Current assets
24,333
23,361
1,134
629
Non-current assets
230,281
245,492
118,037
120,525
Current liabilities
(10,685)
(14,126)
(51)
(83)
Non-current liabilities
(24,258)
(31,630)
0
0
Net assets
219,671
223,097
119,120
121,071
Net assets attributable to minorities
92,800
94,284
63,146
64,180
(EUR thousand)
2014
2013
2014
2013
CASH FLOW from operations
10,499
8,222
(1,082)
(10,324)
CASH FLOW from investment assets
(973)
(3,183)
0
0
CASH FLOW from financial assets
(9,972)
(14,316)
4,672
9,615
NET INCREASE IN CASH AND CASH EQUIVALENTS
(446)
(9,277)
3,590
(709)
Dividends paid to minorities during the year
(3,229)
(5,556)
0
0
114 DeA Capital - Annual Financial Statements to 31 December 2014
6 - Non-current liabilities
6a - End-of-service payment fund
The end-of-service payment fund (TFR) is a defined benefit plan, and as such was measured using actuarial methodology. This
resulted in a liability calculated in demographic and financial terms on amounts owed to workers according to the number of
years worked. The total present value of the liability is proportioned to the period of employment already completed at the
calculation date, taking account of future salary increases and the employee's projected length of service.
Future TFR flows were discounted to the reporting date, using independent actuaries, based on the projected unit credit method.
The valuation assumptions use an annual average discount rate that takes the iBoxx Eurozone Corporates AA 10+ index as a
benchmark, maintaining this parameter as constant compared with previous valuations.
Changes in TFR in 2014 are shown in the table below:
Balance at
Portion
Balance at
(EUR thousand)
1.1.2014
accrued
Payments
Advances
31.12.2014
Change in end-of-service
payment fund
3,529
1,572
(483)
0
4,618
The amounts recognised in the item were calculated as follows:
(EUR thousand)
31.12.2014
31.12.2013
Nominal value of end-of-service payment fund
3,871
3,359
Discounting effect
747
170
Current value of end-of-service payment fund
4,618
3,529
6b - Non-current financial liabilities
The item totalled EUR 5,201 thousand (EUR 150,198 thousand at 31 December 2013) and mainly relates to an amount of EUR
4,000 thousand in connection with a medium-term loan taken out by IDeA FIMIT SGR with Banca Intermobiliare di Investimenti
e Gestioni S.p.A. in 2009 (maturing on 31 March 2016 with a floating rate of 3-month Euribor + spread) for the purchase of units
in the Omicron Plus fund.
6c - Other payables
This item totalled EUR 11,397 thousand at 31 December 2014 and relates to the allocation of carried interest to be paid to the
lead investor BC Partners as a result of the total capital gain on the investment in Kenan.
7 - Current liabilities
Current payables amounted to EUR 36,003 thousand at 31 December 2014 (EUR 72,338 thousand at 31 December 2013) and
are all due within the following year. These payables are not secured on any company assets.
7a - Trade payables
Trade payables were EUR 18,180 thousand at 31 December 2014 versus EUR 15,599 thousand at 31 December 2013.
This item mainly relates to an amount of EUR 8,843 thousand for expenses incurred by IRE in its own name but on behalf of the
funds managed by IDeA FIMIT SGR and subsequently re-invoiced to them. This activity was carried out by virtue of a mandate
without representation signed by IRE and IDeA FIMIT SGR on 12 December 2012.
In respect of transactions with related parties, this item includes payables to:
- the affiliate, De Agostini Editore S.p.A., of approximately EUR 42 thousand;
- the affiliate, De Agostini Libri S.p.A., of approximately EUR 2 thousand;
- the affiliate, De Agostini Invest S.A., of approximately EUR 25 thousand.
Trade payables do not accrue interest and are settled, on average, within 30 to 60 days.
DeA Capital - Annual Financial Statements to 31 December 2014
115

7b - Payables in respect of staff and social security organisations
This item totalled EUR 8,122 thousand at 31 December 2014 versus EUR 6,833 thousand at end-2013, and is largely due to:
- payables to social security organisations of EUR 975 thousand, paid after the close of the Financial Year 2014, with the
exception of payables for social security liabilities calculated on accrued bonuses;
- payables to employees and directors of EUR 6,597 thousand for holidays not taken and accrued bonuses;
- other payables to employees totalling EUR 550 thousand.
7c - Current tax payables
This item totalled EUR 2,012 thousand at 31 December 2014 (EUR 6,956 thousand at end-2013) and is largely due to the
payable of EUR 1,587 thousand to the Parent Company De Agostini S.p.A. from IDeA Capital Funds SGR relating to its joining the
tax consolidation scheme.
The latter amount relates to the payable connected with the option for DeA Capital S.p.A. and IDeA Capital Funds SGR to join
the Italian tax consolidation scheme of the De Agostini S.p.A. Group. This was exercised jointly by each company and the Parent
Company De Agostini S.p.A. by signing the “Regulation for participation in the national tax consolidation scheme for companies
in
the De Agostini Group” and notifying the tax authorities of this option
pursuant to the procedures and terms and conditions set
out by law.
7d - Other tax payables
This item, of EUR 2,037 thousand at 31 December 2014 (EUR 1,478 thousand at end-2013), mainly relates to the payable to the
tax authorities in respect of taxes deducted from the income of employees and self-employed staff totalling EUR 1,502 thousand.
7e - Other payables
This item was EUR 5,292 thousand at 31 December 2014 (EUR 2,054 thousand at end-2013) and mainly relates to the allocation
of a payable to the former shareholders of FIMIT SGR to compensate them for waiving the cash flows resulting from the property
services platform created at IRE.
7f - Short-term financial payables
This item totalled EUR 360 thousand at 31 December 2014 (EUR 39,418 thousand at 31 December 2013) and reflects the
remaining amount owed on the price for the business division transferred to IDeA FIMIT SGR by Duemme SGR.
Contingent liabilities
IAS 37 defines a contingent liability as a possible obligation arising from past events and whose existence will be confirmed
only by the occurrence or non-occurrence of one or more uncertain future events not wholly within the control of the entity.
Companies must not recognise contingent liabilities, but should still disclose them.
On 17 December 2014, DeA Capital S.p.A. received an assessment notice for the 2009 tax year of IDeA Alternative Investments
S.p.A., a company which was merged into DeA Capital S.p.A. with effect from 1 January 2012. The assessment, which alleged
that revenues had been under-reported, was challenged in an appeal by DeA Capital before the Milan Provincial Tax Court.
An adverse outcome, which is possible but not likely, could result in taxes and penalties of EUR 0.7 million.
116 DeA Capital - Annual Financial Statements to 31 December 2014
Income statement
8 - Alternative asset management fees
Alternative asset management fees in 2014 were EUR 66,045 thousand versus EUR 76,356 thousand in 2013.
These fees mainly relate to management fees paid to IDeA FIMIT SGR and IDeA Capital Funds SGR for the funds they manage.
9 - Income from investments valued at equity
This item includes income from companies valued at equity for the period.
The loss of EUR 1,673 thousand in 2014 compared with a gain of EUR 6,586 thousand in 2013 was mainly due to the loss
reported for the stake in Sigla of about EUR -887 thousand and the loss related to the stake in AVA of EUR -786 thousand.
10 - Other investment income and expenses
The net expenses realised on investments in shareholdings and funds totalled around EUR 56,149 thousand in 2014, compared
with expenses of EUR 24,617 thousand in 2013.
Details are shown below:
Financial year
Financial year
(EUR thousand)
2014
2013
Income from venture capital fund distributions
298
278
Income from real estate fund distributions
1,135
2,577
Capital gains on disposals
8,749
95
Dividends from minor available-for-sale investments
108
33
Other income
40
24
Investment income
10,330
3,007
Losses on disposals of equity investments in subsidiaries
0
201
Impairment venture capital funds
385
76
Impairment private equity funds
933
978
Impairment real estate funds
516
3,987
Impairment Santé
59,470
14,848
Impairment Alkimis
0
188
Impairment Harvip
0
557
Impairment Soprarno
0
389
Impairment Giochi Preziosi
0
5,400
Impairment Grandi Navi Veloci
0
1,000
Impairment Euticals
5,070
0
Other charges
105
0
Investment charges
66,479
27,624
Total
(56,149)
(24,617)
DeA Capital - Annual Financial Statements to 31 December 2014
117

Investment income
Income from available-for-sale venture capital funds was EUR 298 thousand and came from capital gains from distributions of
venture capital funds.
The
‘capital gains on sales’ item includes an amount of EUR 8,749 thousand
relating to capital gains made on the partial sale of the
shareholding in Telit by IDeA OF I.
The item also includes amounts totalling EUR 1,135 thousand of income distributed in 2014 to IDeA FIMIT SGR by the following
funds: Beta (EUR 15 thousand), Omicron Plus (EUR 580 thousand), Atlantic 1 (EUR 226 thousand) and Conero (EUR 314
thousand).
Impairment
The fair value measurement of investments in funds and shareholdings at 31 December 2014 is based on information and
documents received from the funds and shareholdings, and other available information.
The fair value measurement of investments in funds at 31 December 2014, carried out based on the documents received and the
information available, made it necessary to record impairment of EUR 385 thousand in respect of the venture capital funds and
EUR 933 thousand for the closed-end mutual investment funds.
For these funds, the significant reduction below cost was considered clear evidence of impairment, and necessitated these write-
downs.
The impairment charge of EUR 516 thousand on real estate funds relates to the reduction in the value of units in the Agris,
Gamma, Senior and Theta funds.
On 1 October 2014, Santé and SDE sold their stake in GDS at a price of EUR 16.00 per share after cashing in the dividend of EUR
0.75 per share due to them. The net proceeds for the DeA Capital Group from this transaction were EUR 164,095 thousand. The
resulting loss from the sale totalled EUR 59,470 thousand.
11 - Service revenues
In 2014, these revenues totalled EUR 18,667 thousand, compared with EUR 16,329 thousand in 2013, and chiefly relate to
services connected with consulting, management and the sale of real estate held in the portfolios of real estate funds.
12 - Other revenues and income
Other revenues and income, totalling EUR 509 thousand in 2014 (compared with EUR 4,032 thousand in 2013), relate mainly to
directors' fees from Santé S.A. of EUR 245 thousand.
13 - Operating costs
Operating costs in 2014 were EUR 87,957 thousand, compared with EUR 129,426 thousand in the previous year.
13a - Personnel costs
Total personnel costs were EUR 33,579 thousand in 2014, compared with EUR 28,241 thousand in 2013.
118 DeA Capital - Annual Financial Statements to 31 December 2014
Financial year
Financial year
(EUR thousand)
2014
2014
Salaries and wages
17,842
16,779
Social security contributions
4,891
4,559
Remuneration for the Board of Directors
4,806
4,633
Stock option figurative cost
937
1,194
End-of-service payment fund
1,172
894
Other personnel costs
4,854
2,786
Reversal stock options and long-term incentive plans
(923)
(2,604)
Total
33,579
28,241
The effect of the cost arising from the stock option plans for 2014, of EUR 937 thousand, was offset by the reversal of the
cost allocated to the reserve for the Stock Option Plan 2012-2014 of the Parent Company, of EUR 815 thousand. The Parent
Company's Allocation Plan 2012-2014 is to be considered lapsed as the conditions for exercising option rights were not met.
At 31 December 2014, the DeA Capital Group had a total of 224 employees (208 at 31 December 2013).
The table below shows the changes and average number of Group employees during 2014.
Average
Employees
1.1.2014
Recruits Departures
31.12.2014
no.
Managers
34
6
(2)
38
36
Junior managers
62
10
(7)
65
63
Office staff
112
21
(12)
121
118
Total
208
37
(21)
224
217
Share-based payments
Employees of DeA Capital S.p.A. and the Parent Company, De Agostini S.p.A. are beneficiaries of stock option plans based on the
shares of DeA Capital S.p.A. Unexercised but valid call options on the Company’s shares at 31 December 2014 totalled 3,163,200
(2,643,200 at 31 December 2013).
Stock option plans were valued using the numerical binomial tree procedure (the original Cox, Ross and Rubinstein method).
Numerical analysis using binomial trees generates simulations of various possible developments in the share price in future
periods.
On 17 April 2014, the shareholders’ meeting of DeA Capital S.p.A. approved the DeA Capital Stock Option Plan 2014-2016. To
implement the resolution of the shareholders’ meeting, the Board of Directors voted (i) to implement the DeA Capital Stock
Option Plan 2014-2016 approved by the shareholders’ meeting, vesting the Chairman of the Board of Directors and the Chief
Executive Officer with all necessary powers, to be exercised jointly or severally and with full power of delegation; and (ii) to
allocate a total of 1,550,000 options to certain employees of the Company, its subsidiaries and of the Parent Company De
Agostini S.p.A. who carry out important roles for the Company.
In line with the criteria specified in the regulations governing the DeA Capital S.p.A. Stock Option Plan 2014-2016, the Board
of
Directors also set the exercise price for the options allocated at EUR
1.32, which is the arithmetic mean of the official price
of ordinary DeA Capital shares on the Mercato Telematico Azionario, the Italian screen-based trading system organised and
managed by Borsa Italiana S.p.A., on the trading days between 17 March 2014 and 16 April 2014.
The
shareholders’ meeting of 17 April 2014 also approved a paid capital
increase, in divisible form, without option rights, via the
issue of a maximum of 2,000,000 ordinary shares to service the DeA Capital S.p.A. Stock Option Plan 2014-2016.
DeA Capital - Annual Financial Statements to 31 December 2014
119
The options can be allocated to the beneficiaries up to 31 December 2014 and exercised by the latter, in one or more tranches,
but in any case for an amount per tranche of not less than 25% of the options assigned to each, with effect from the fifth
calendar day following the date that the adjusted NAV figure at 31 December 2016 is announced, until 31 December 2019.
The adjusted NAV means the value of the assets, net of liabilities, calculated on the basis of the Company’s Statement of
Financial Position at 31 December 2016 and restated, where necessary, to take account of the measurement at fair value of all
investments, as assessed by an independent third party.
The shareholders’ meeting also approved the adoption of the Performance Share Plan 2014-2016, which provides for the
allocation of a maximum of 500,000 units. On the same date, in implementation of the shareholders’ resolution, the Board
of Directors of DeA Capital S.p.A. voted (i) to launch the DeA Capital Performance Share Plan 2014-2016 approved by the
shareholders’ meeting, vesting the Chairman of the Board of Directors and the Chief Executive Officer with all the necessary
powers, to be exercised severally and with full power of delegation; and (ii) to allocate a total of 393,500 units (representing the
right to receive ordinary shares in the Company free of charge, under the terms and conditions of the plan) to certain employees
of the Company, its subsidiaries and of the Parent Company De Agostini S.p.A. who carry out important roles for the Company.
The shares allocated due to the vesting of units will be drawn from the treasury shares already held by the Company so that the
allocation will not have a dilutive effect.
The shareholders’ meeting also approved the Company’s Remuneration Policy pursuant to art. 123-ter of the Consolidated
Finance Law.
The terms and conditions of the Stock Option Plan 2014-2016 and the Performance Share Plan 2014-2016 are described in the
Information Prospectus prepared in accordance with art. 84-bis of Consob Resolution 11971 of 14 May 1999 (Issuer Regulations),
available to the public at the registered office of DeA Capital S.p.A. and on the Company’s website www.deacapital.it (in the
section Corporate Governance/Incentive Plans).
No loans and/or guarantees in favour of directors and/or auditors of the Parent Company and its subsidiaries were issued.
13b - Service costs
Service costs were EUR 30,734 thousand in 2014 versus EUR 22,897 thousand in 2013.
A breakdown of these costs is shown in the table below:
Financial year
Financial year
(EUR thousand)
2014
2013
Management, tax, legal consultancy and other fees
11,202
8,845
Fees to corporate bodies
773
1,028
Ordinary maintenance
168
320
Travel expenses
1,226
1,209
Utilities and general expenses
1,623
2,292
Third-party rental, royalties and leasing
4,434
3,256
Bank charges
118
249
Books, office supplies and conferences
534
625
Commission expense
4,351
832
Other charges
6,305
4,241
Total
30,734
22,897
120 DeA Capital - Annual Financial Statements to 31 December 2014
13c - Depreciation, amortisation and impairment losses
Please see the table on changes in intangible and tangible assets for details on this item.
13d - Other costs
This item totalled EUR 6,921 thousand (EUR 5,074 thousand in 2013) and mainly consisted of:
• an adjustment of the IDeA FIMIT SGR receivable from the Beta fund for final variable commission, and the write-down of
receivables for fixed commissions of the Agris, Atlantic 6 and Eta funds, of EUR 4,044 thousand;
• the cost incurred by IDeA FIMIT SGR and DeA Capital totalling EUR 2,731 thousand resulting from the inability to deduct VAT
released on purchase transactions on the basis of the pro-rata amount specified by art. 19 of Presidential Decree 633/1972.
14 - Financial income and charges
14a - Financial income
Financial income totalled EUR 7,313 thousand in 2014 (EUR 5,992 thousand in 2013) and included interest income of EUR 2,346
thousand on the quasi-equity loan provided to the subsidiary Santé and income of EUR 2,206 thousand from the cancellation of
the earn-out payable to the seller of FARE Holding (currently DeA Capital Real Estate).
Financial year
Financial year
(EUR thousand)
2014
2013
Interest income
3,447
4,915
Income on derivatives
302
830
Other income on AFS instruments
0
205
Income from earn-out adjustment
2,206
0
Exchange gains
1,358
42
Total
7,313
5,992
14b - Financial charges
Financial charges totalled EUR 4,408 thousand in 2014, compared with EUR 6,430 thousand in 2013. These mainly included
interest payable on loans and losses on hedging derivatives.
Specifically, financial charges mainly break down as follows:
- interest payable on the line of credit granted by Mediobanca and Intesa of EUR 2,750 thousand and fees of EUR 519 thousand;
- interest payable on the medium-term credit line taken out by the subsidiary IDeA FIMIT SGR with Banca Intermobiliare di
Investimenti e Gestioni S.p.A. of EUR 255 thousand;
- interest payable relating to the vendor loan to acquire the tranche of mezzanine bonds issued by SDE, totalling EUR 441
thousand.
Financial year
Financial year
(EUR thousand)
2014
2013
Interest payable
4,068
4,271
Charges on derivatives
0
1,103
Exchange losses
267
396
Financial charges IAS 19
73
66
Other charges
0
594
Total
4,408
6,430
DeA Capital - Annual Financial Statements to 31 December 2014
121
15 - Income tax for the period, deferred tax assets and deferred tax liabilities
This item, totalling EUR 1,720 thousand for 2014 (EUR -4,381 thousand in 2013), includes current income tax due for the year of
EUR -7,756 thousand and deferred tax assets of EUR +9,476 thousand.
The table below shows the taxes determined on the basis of the rates and the Group’s taxable income. The latter was calculated
in light of applicable legislation.
Financial year
Financial year
(EUR thousand)
2014
2013
Current tax:
- Income from tax consolidation scheme
1,747
3,281
- IRES
(6,743)
(13,136)
- IRAP
(2,757)
(3,594)
- Other taxes
(3)
0
Total current taxes
(7,756)
(13,449)
Deferred taxes for the period:
- Charges for deferred/prepaid taxes
(1,016)
(45)
- Income from deferred/prepaid taxes
9,792
8,391
- Use of deferred tax liabilities
722
722
- Use of deferred tax assets
(22)
0
Total deferred taxes
9,476
9,068
Total income tax
1,720
(4,381)
The table below shows a reconciliation of the tax charges recorded in the Consolidated Financial Statements and the theoretical
tax charge for 2014 calculated using the corporate income tax (IRES) rate applicable in Italy.
2014
2013
(EUR thousand)
Amount
rate
Amount
rate
Profit before tax
(57,653)
(51,248)
Tax on theoretical income
(15,855)
27.5%
(14,093)
27.5%
Participation in participation exemption
304
(0.5%)
0
0.0%
Tax on intragroup dividends
432
(0.7%)
0
0.0%
Write-down of intangible assets - variable final
commission
1,348
(2.3%)
5,540
(10.8%)
Write-downs of equity investments
and receivables
856
(1.5%)
2,211
(4.3%)
Effect of companies with different
tax systems from that of Italy
23,220
(40.3%)
0
0.0%
Use of tax losses not previously recognised
0
0.0%
0
0.0%
Net profit/(loss) from subsidiaries
not subject to taxation
(767)
1.3%
1,465
(2.9%)
Net profit/(loss) from associates
not subject to taxation
460
(0.8%)
(512)
1.0%
Non-deductible interest
94
(0.2%)
469
(0.9%)
Income from tax consolidation scheme
(836)
1.5%
(2,339)
4.6%
Other net differences
(3,525)
6.1%
19,452
(38.0%)
Net effect of pre-paid/deferred tax assets
(9,375)
16.3%
(11,407)
22.3%
IRAP and other taxes on foreign income
1,924
(3.3%)
3,595
(7.0%)
Income tax reported in the income
statement
(1,720)
+3.0%
4,381
(8.5%)
122 DeA Capital - Annual Financial Statements to 31 December 2014
16 - Basic earnings (loss) per share
Basic earnings per share are calculated by dividing net profit for the period attributable to the Group's shareholders by the
weighted average number of shares outstanding during the period.
Diluted earnings per share are calculated by dividing net profit for the period attributable to the Group's shareholders by
the weighted average number of shares outstanding during the period including any diluting effects of existing stock option
plans, in the event the allocated options are “in the money”.
The table below shows the income and the share information used to calculate basic and diluted earnings per share:
Financial year
Financial year
(EUR thousand)
2014
2013
Consolidated profit/(loss) excluding minorities (A)
(57.601)
(31.130)
Weighted average number of ordinary shares outstanding (B)
273.806.403
273.994.870
Basic earnings/loss per share (EUR per share) (C=A/B)
(0,210)
(0,114)
Adjustment for dilutive effect
-
-
Consolidated net profit/(loss) adjusted for dilutive effect (D)
(57.601)
(31.130)
Weighted average number of shares to be issued for the
exercise of stock options (E)
306.445
-
Total number of shares outstanding and to be issued (F)
274.112.848
273.994.870
Diluted earnings/loss per share (EUR per share) (G=D/F)
(0,210)
(0,114)
Options have a dilutive effect only when the average market price of the share for the period exceeds the strike price of the
options or warrants (i.e. when they are “in the money”).
Primary and secondary reporting formats
The information on businesses reflects the Group's internal reporting structure. These businesses are:
- Private Equity Investment, which includes the reporting units involved in investment activities and breaks down into equity
investments (direct investments) and investments in funds (indirect investments);
- Alternative Asset Management, which includes reporting units involved in asset management activities and related services,
with a current focus on the management of private equity and real estate funds.
DeA Capital - Annual Financial Statements to 31 December 2014
123

Summary Group Income Statement -
performance by business in 2014
Alternative
Holding
Private Equity
Asset
companies /
(EUR thousand)
Investment Management
Eliminations
Consolidated
Alternative Asset Management fees
0
68,549
(2,504)
66,045
Income from investments valued at equity
(1,149)
(524)
0
(1,673)
Other investment income/charges
(56,812)
663
0
(56,149)
Other revenues and income
146
18,357
673
19,176
Other costs and charges
(5,930)
(71,152)
(10,875)
(87,957)
Financial income and charges
3,006
155
(256)
2,905
PROFIT (LOSS) BEFORE TAXES
(60,739)
16,048
(12,962)
(57,653)
Income tax
0
(6,584)
8,304
1,720
PROFIT (LOSS) FOR THE YEAR FROM
CONTINUING OPERATIONS
(60,739)
9,464
(4,658)
(55,933)
Profit/(loss) from assets held-for-sale/sold
0
0
0
0
Profit/(loss) for the year
(60,739)
9,464
(4,658)
(55,933)
- Profit/(loss) attributable to the Group
(62,235)
9,292
(4,658)
(57,601)
- Profit/(loss) attributable to minorities
1,496
172
0
1,668
Summary Group Income Statement -
performance by business in 2013
Alternative
Società
Private Equity
Asset
Holdings/
(EUR thousand)
Investment Management
Elisioni
Consolidated
Alternative Asset Management fees
0
78,810
(2,454)
76,356
Income from investments valued at equity
6,940
(354)
0
6,586
Other investment income/charges
(23,264)
(1,353)
0
(24,617)
Other revenues and income
3,181
16,750
430
20,361
Other costs and charges
(4,797)
(121,962)
(2,737)
(129,496)
Financial income and charges
927
(190)
(1,175)
(438)
PROFIT (LOSS) BEFORE TAXES
(17,013)
(28,299)
(5,936)
(51,248)
Income tax
1,294
(9,213)
3,538
(4,381)
PROFIT (LOSS) FOR THE YEAR FROM
CONTINUING OPERATIONS
(15,719)
(37,512)
(2,398)
(55,629)
Profit/(loss) from assets held-for-sale/sold
0
0
0
0
Profit/(loss) for the year
(15,719)
(37,512)
(2,398)
(55,629)
- Profit/(loss) attributable to the Group
(10,389)
(18,343)
(2,398)
(31,130)
- Profit/(loss) attributable to minorities
(5,330)
(19,169)
0
(24,499)
Alternative
Asset Management costs include the effects of the amortisation and
write-down of intangible assets, totalling EUR -14.7
million, recorded when a portion of the purchase price of the investments was allocated.
124 DeA Capital - Annual Financial Statements to 31 December 2014

Notes to the Cash Flow Statement
Given
the type of activity carried out by the Group, cash flow from
investment in companies and funds (one of the Group’s typical
activities) is included in cash flow from operating activities.
In 2014, operating activities, as defined above, generated cash and cash equivalents of EUR 188,419 thousand (while EUR
49,664 thousand was absorbed in 2013). Please see the Consolidated Cash Flow Statement for information on changes to this
item.
In 2014, financial activities absorbed EUR 157,756 thousand (while in 2013 they generated EUR 50,274), mainly connected with
the
final repayment of the credit lines in place with Mediobanca - Banca di
Credito Finanziario S.p.A. and Intesa Sanpaolo of EUR
147,000 thousand.
Cash and cash equivalents totalled EUR 55,583 thousand at end-2014, compared with EUR 26,396 thousand at the end of the
previous year.
Changes to the Cash Flow Statement have been reported using the direct method.
Other information
Commitments
At 31 December 2014, residual commitments for payments to funds totalled EUR 106.5 million, compared with EUR 104.8 million
at end of 2013. Changes in commitments are shown in the table below:
(EUR million)
Residual commitments to funds - 31.12.2013
104.8
Distributions reclassified from callable to non-callable
(1.2)
Change in commitmentsof VC funds
0.1
New commitments
21.1
Capital Calls
(18.6)
Exchange differences
0.3
Residual commitments to funds - 31.12.2014
106.5
Net financial position at 31 December 2014
57.8
NFP vs. Residual Commitments - 31.12.2014 (Overcommitment)
(48.7)
With regard to these overcommitments, the management believes that the funds and credit lines currently available, as well as
funds that will be generated by its operating and financing activities, will enable the DeA Capital Group to meet the financing
required for its investment activity, manage working capital and repay debts when they become due.
Treasury shares and Parent Company shares
On
17 April 2014, the shareholders’ meeting of DeA Capital S.p.A.
authorised the Board of Directors to buy and sell, on one or more
occasions and on a rotating basis, a maximum number of ordinary shares in the Company representing a stake of up to 20% of the
share capital.
The new plan replaces the previous plan approved by the shareholders’ meeting on 19 April 2013 (which was scheduled to expire
with the approval of the 2013 Annual Financial Statements), and will pursue the same objectives as the previous plan, including
purchasing treasury shares to be used for extraordinary transactions and share incentive schemes, offering shareholders a means
of monetising their investment, stabilising the share price and regulating trading within the limits of current legislation.
DeA Capital - Annual Financial Statements to 31 December 2014
125

The
authorisation specifies that purchases may be carried out up to the
date of the shareholders’ meeting to approve the Financial
Statements for the Year Ending 31 December 2014 and, in any case, not beyond the maximum duration allowed by law, in
accordance
with all the procedures allowed by current regulations, and that DeA
Capital S.p.A. may also sell the shares purchased
for
the purposes of trading, without time limits. The unit price for the
purchase of the shares is set on a case-by-case basis by
the Company's Board of Directors, but in any case must not be more than 20% above or below the share’s reference price on the
trading
day prior to each individual purchase. In contrast, the authorisation
to sell treasury shares already held in the Company’s
portfolio, and any shares bought in the future, was granted for an unlimited period, to be implemented using the methods
considered most appropriate and at a price to be determined on a case-by-case basis by the Board of Directors, which must not,
however,
be more than 20% below the share's reference price on the trading day
prior to each individual sale (apart from in certain
exceptional cases specified in the plan). Sale transactions may also be carried out for trading purposes.
On
the same date, the Board of Directors voted to launch the plan to buy
and sell treasury shares authorised by the shareholders’
meeting, vesting the Chairman of the Board of Directors and the Chief Executive Officer with all the necessary powers, to be
exercised jointly or severally and with full power of delegation.
On 6 November 2014, the Board of Directors, voted to adhere to the markets practice intended for the purchase of own shares to
be used to create the securities “stock”, pursuant Consob resolution 16839 of 19 march 2009.
In 2014, DeA Capital S.p.A. purchased around 2,348,732 million shares valued at about EUR 3.7 million (at an average price of
approximately EUR 1.58 per share).
Taking
into account purchases made in previous years for plans in place from
time to time, and the use of treasury shares to service
purchases of controlling interests in FARE Holding and IDeA Alternative Investments, at 31 December 2014 the Company owned
34,985,736 treasury shares (equal to about 11.4% of share capital).
As of the date of this document, based on purchases of 2,383,540 shares made after the end of 2014, the Company had a total of
37,369,276 treasury shares corresponding to about 12.2% of the share capital.
During 2014, the Company did not hold, purchase or sell, on its own account or through a trust company, any shares in the Parent
Company De Agostini S.p.A.
Stock option and performance share plans
On 17 April 2014, the shareholders’ meeting of DeA Capital S.p.A. approved the DeA Capital Stock Option Plan 2014-2016.
To implement the resolution of the shareholders’ meeting, the Board of Directors voted (i) to launch the DeA Capital Stock
Option Plan 2014-2016 approved by the shareholders’ meeting, vesting the Chairman of the Board of Directors and the
Chief Executive Officer with all necessary powers, to be exercised jointly or severally and with full power of delegation; and
(ii) to allocate a total of 1,550,000 options to certain employees of the Company, its subsidiaries and of the Parent Company
De Agostini S.p.A. who carry out important roles for the Company.
In line with the criteria specified in the regulations governing the DeA Capital S.p.A. Stock Option Plan 2014-2016, the
Board of Directors also set the exercise price for the options allocated at EUR 1.32, which is the arithmetic mean of the
official price of ordinary DeA Capital shares on the Mercato Telematico Azionario, the Italian screen-based trading system
organised and managed by Borsa Italiana S.p.A., on the trading days between 17 March 2014 and 16 April 2014.
The shareholders’ meeting of 17 April 2014 also approved a paid capital increase, in divisible form, without option rights, via
the issue of a maximum of 2,000,000 ordinary shares to service the DeA Capital S.p.A. Stock Option Plan 2014-2016.
The shareholders’ meeting also approved the adoption of the Performance Share Plan 2014-2016, which provides for
the allocation of a maximum of 500,000 units. On the same date, in implementation of the shareholders’ resolution, the
Board of Directors of DeA Capital S.p.A. voted (i) to launch the DeA Capital Performance Share Plan 2014-2016 approved
by the shareholders’ meeting, vesting the Chairman of the Board of Directors and the Chief Executive Officer with all the
necessary powers, to be exercised severally and with full power of delegation; and (ii) to allocate a total of 393,500 units
(representing the right to receive ordinary shares in the Company free of charge, under the terms and conditions of the
plan) to certain employees of the Company, its subsidiaries and of the Parent Company De Agostini S.p.A. who carry out
important roles for the Company.
126 DeA Capital - Annual Financial Statements to 31 December 2014
The shares allocated due to the vesting of units will be drawn from the treasury shares already held by the Company so that
the allocation will not have a dilutive effect.
The shareholders’ meeting also approved the Company’s Remuneration Policy pursuant to art. 123-ter of the Consolidated
Finance Law.
The terms and conditions of the Stock Option Plan 2014-2016 and the Performance Share Plan 2014-2016 are described
in the Information Prospectus prepared in accordance with art. 84-bis of Consob Resolution 11971 of 14 May 1999 (Issuer
Regulations), available to the public at the registered office of DeA Capital S.p.A. and on the Company’s website
The tables below summarise the assumptions made in calculating the fair value of the plans:
Stock Option
2004 plan
2005 plan
2012 plan
2013 plan
2014 plan
N° options allocated
160,000
180,000
1,030,000
1,550,000
1,550,000
Average market price at allocation date
2.445
2.703
1.38
1.26
1.44
Value at allocation date
391,200
486,540
1,421,400
1,953,000
2,232,000
Average exercise price
2.026
2.459
1.3363
1.289
1.32
Expected volatility
31.15%
29.40%
33.84%
32.94%
31.63%
Option expiry date
31/08/15
30/04/16
31/12/17
31/12/18
31/12/19
Risk free yield
4.25%
3.60%
2.47%
1.55%
1.56%
The Allocation Plan 2012-2014 is to be considered lapsed as the conditions for exercising option rights were not met.
Performance Share
2012 plan
2013 plan
2014 plan
N° options allocated
302,500
393,500
393,500
Average market price at allocation date
1.380
1.260
1.44
Value at allocation date
417,450
495,810
566,640
Expected volatility
33.84%
32.94%
31.63%
Option expiry date
31/12/14
31/12/15
31/12/16
Risk free yield
2.47%
1.55%
1.56%
DeA Capital - Annual Financial Statements to 31 December 2014
127

Transactions with parent companies, subsidiaries and related parties
Transactions with related parties
Transactions with related parties, including those with other Group companies, were carried out in accordance with the
Procedure for Related Party Transactions adopted by the Company with effect from 1 January 2011 in accordance with the
provisions of the Regulation adopted pursuant to art. 2391-bis of the Italian Civil Code with Consob Resolution 17221 of 12
March 2010 as subsequently amended. During the year, the Company did not carry out any atypical or unusual transactions
with related parties but only those that are part of the normal business activities of Group companies. It also did not carry
out any “significant transactions” as defined in the aforementioned procedure. Transactions with related parties during the
year were concluded under standard market conditions for the nature of the goods and/or services offered.
With regard to transactions with parent companies, note the following:
1) DeA Capital S.p.A. signed a service agreement with the controlling shareholder, De Agostini S.p.A., for the latter to
provide operating services in the administration, finance, control, legal, corporate and tax areas.
This agreement, which is renewable annually, is priced at market rates and is intended to allow the Company to maintain a
streamlined organisational structure in keeping with its development policy, while obtaining sufficient operational support.
At the same time, on 1 January 2013, DeA Capital S.p.A. signed an “Agreement to sub-let property for use other than
residential use” with the controlling shareholder, De Agostini S.p.A. The agreement relates to parts of a building located at
Via Brera, 21, Milan, comprising space for office use, warehousing and car parking.
This agreement is renewable every six years after an initial term of seven years.
2) DeA Capital S.p.A., IDeA Capital Funds SGR and DeA Capital Real Estate have adopted the national tax consolidation
scheme of the De Agostini Group (the Group headed by De Agostini S.p.A., formerly B&D Holding di Marco Drago e
C. S.a.p.a.). This option was exercised jointly by each company and De Agostini S.p.A. by signing the “Regulation for
participation in the national tax consolidation scheme for companies in the De Agostini Group” and notifying the tax
authorities of this option pursuant to the procedures and terms and conditions set out by law. The option is irrevocable
unless the requirements for applying the scheme are not met.
The option is irrevocable for DeA Capital S.p.A. for the three-year period 2014-2016, for IDeA Capital Funds SGR for the
three-year period 2012-2014 and for DeA Capital Real Estate for the three-year period 2013-2015.
3) In order to enable the more efficient use of liquidity and the activation of credit lines with potentially better terms
and conditions compared with those that may be obtained from banks, DeA Capital S.p.A. has signed a framework
agreement (Framework Agreement) with the Parent Company De Agostini S.p.A. for the provision of short-term
intercompany loans.
Deposit/financing operations falling within this Framework Agreement shall only be activated subject to verification that
the terms and conditions determined at any time are advantageous, and will be provided on a revolving basis, and with
maturities of not more than three months. The Framework Agreement shall have a duration of one year and is renewable.
The amounts involved in the deposit/financing operations will, however, be below the thresholds defined for “transactions
of lesser importance” pursuant to Consob Regulation 17221/2010 (transactions with Related Parties) and the internal
procedure on Transactions with Related Parties adopted by DeA Capital S.p.A.
Lastly, the Company did not hold, purchase or dispose of the shares of any related parties in 2014.
128 DeA Capital - Annual Financial Statements to 31 December 2014
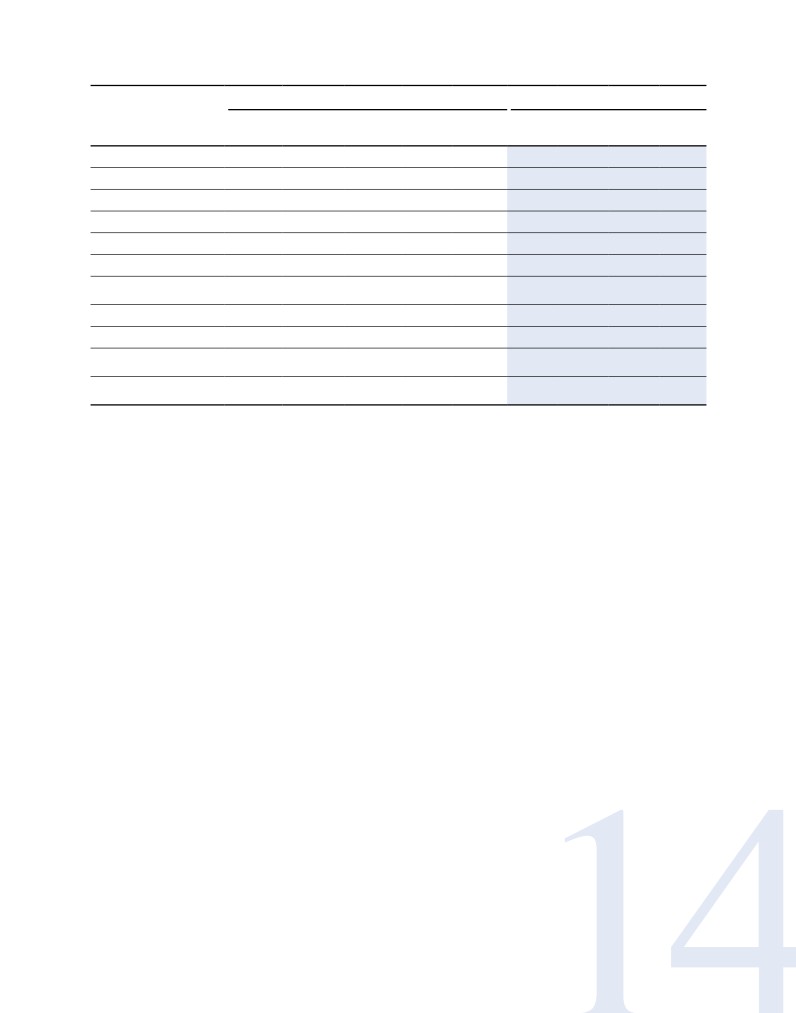
The table below summarises the amounts of trade-related transactions with related parties.
31.12.2014
Year 2014
Revenues
Financial
Trade
Tax
Tax
Trade
for Financial Personnel Service
(EUR thousand)
receivables receivables receivables payables payables services
income
costs
costs
Sigla S.r.l.
1,710
0
0
0
0
0
17
0
0
De Agostini S.p.A.
0
147
4,079
1,927
17
349
0
142
0
Santé S.A.
0
0
0
0
0
0
0
0
0
De Agostini Editore S.p.A.
0
0
0
0
23
0
0
0
77
De Agostini Libri S.p.A.
0
0
0
0
7
0
0
0
5
Gtech S.p.A.
0
39
0
0
0
29
0
0
0
De Agostini
Publishing S.p.A.
0
5
0
0
0
24
0
0
1
De Agostini Invest S.A.
0
0
0
0
0
0
0
0
0
Total related parties
1,710
191
4,079
1,927
47
403
17
142
84
Total financial
statement line item
30,372
21,078
4,079
6,956
15,599
18,667
7,313
33,579
30,734
as % of financial
statement line item
5.6%
0.9%
100.0%
27.7%
0.3%
2.2%
0.2%
0.4%
0.3%
DeA Capital - Annual Financial Statements to 31 December 2014
129

Remuneration: directors of the board, auditors, general managers and managers with strategic
responsibilities
In 2014, remuneration payable to the directors and auditors of DeA Capital S.p.A. for the performance of their duties totalled
EUR 300 thousand and EUR 175 thousand respectively.
Remuneration paid to directors and auditors is shown in the table below:
Fees for
position at
company
Statutory
preparing
auditors'
the financial
fees for
Period
statements
Non-
Bonuses
positions
Other
position
Position
in EUR
cash
and other
held at
remuneration
Director
Position
held
expires
thousand
benefits
incentives
subsidiaries
EUR/000
Approval fin.
statements
Lorenzo Pellicioli
Chairman
2014
2015
30
0
0
0
0
Approval fin.
Chief Executive
statements
Paolo Ceretti
Officer
2014
2015
30
0
0
0
73
Approval fin.
statements
Lino Benassi
Director
2014
2015
30
0
0
0
112
To 12 March
Stefania Boroli
Director
2014
2015
30
0
0
0
0
Approval fin.
statements
Rosario Bifulco
Director
2014
2015
30
0
0
0
25
Approval fin.
statements
Francesca Golfetto
Director
2014
2015
30
0
0
0
20
Approval fin.
statements
Roberto Drago
Director
2014
2015
30
0
0
0
0
Approval fin.
statements
Marco Drago
Director
2014
2015
30
0
0
0
0
Approval fin.
statements
Severino Salvemini
Director
2014
2015
30
0
0
0
35
Approval fin.
statements
Marco Boroli
Director
2014
2015
30
0
0
0
0
Chairman of
the Board
Approval fin.
of Statutory
statements
Angelo Gaviani
Auditors
2014
2015
75
0
0
9
0
Approval fin.
Permanent
statements
Gian Piero Balducci Auditor
2014
2015
50
0
0
48
34
Approval fin.
Permanent
statements
Annalisa Donesana Auditor
2014
2015
50
0
0
32
10
In contrast to the data contained in the Remuneration Report prepared pursuant to art. 123-ter of the TUF in accordance with
art. 84-quater of the Issuer Regulation, the emoluments and compensation indicated above do not include social security
contributions where applicable.
‘Other
remuneration’ relates to remuneration received for other positions held
in either DeA Capital S.p.A. or other Group companies.
In 2014, annual salaries and bonuses, excluding benefits in kind, paid to managers with strategic responsibilities in the Parent
Company totalled about EUR 621 thousand.
130 DeA Capital - Annual Financial Statements to 31 December 2014
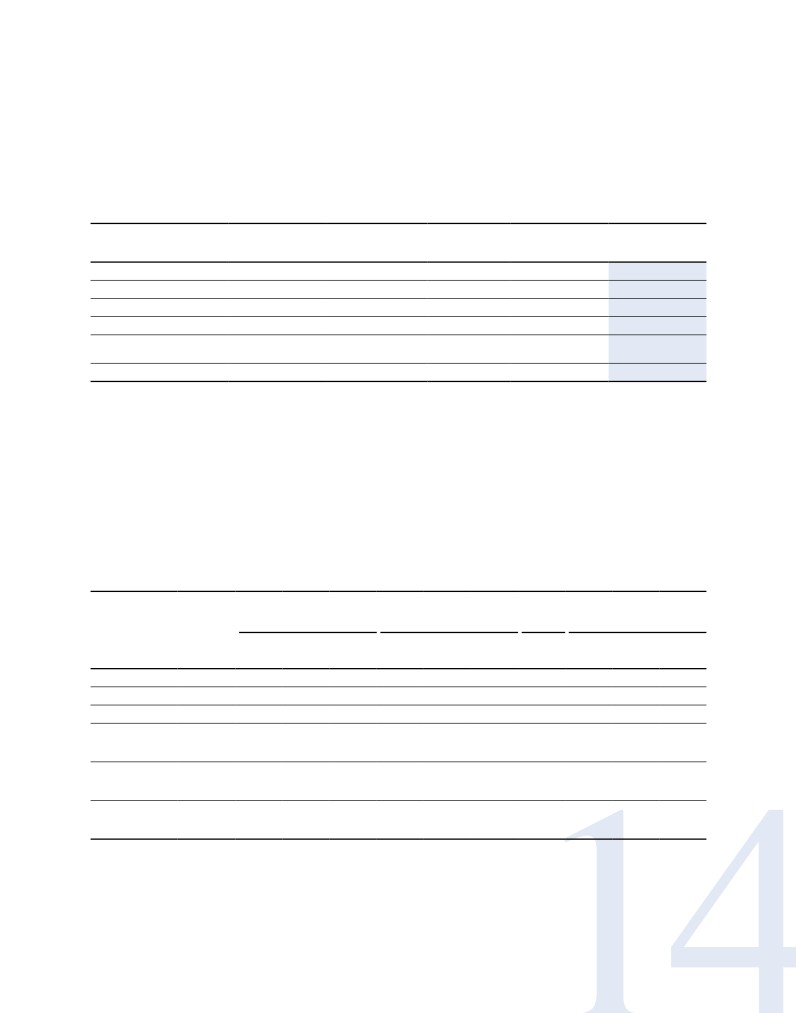
Shareholdings held by directors, auditors, general managers and managers with strategic
responsibilities
Details
of shareholdings held in DeA Capital S.p.A. and its subsidiaries by
members of the boards of directors and auditors and by
managers with strategic responsibilities are provided in aggregate format in the table below.
No shareholdings were reported for general managers, since to date, this position does not exist.
All
those who held positions on the boards of directors or auditors, or as
managers with strategic responsibilities, for the whole or
part of the year in question, are included.
No. of shares
Investee
No. of shares No. of shares
No. of
held at 31
Name and surname
company
held at 1.1.14
purchased
shares sold December 2014
Lorenzo Pellicioli
DeA Capital S.p.A.
2,566,323
0
0
2,566,323
Paolo Ceretti
DeA Capital S.p.A.
1,000,000
0
0
1,000,000
Rosario Bifulco
DeA Capital S.p.A.
1,536,081
0
0
1,536,081
Lino Benassi
DeA Capital S.p.A.
23,500
0
0
23,500
Senior managers with
strategic responsibilities
DeA Capital S.p.A.
105,000
100,000
0
205,000
Total
5,230,904
100,000
0
5,330,904
Other
than the shares indicated above, no DeA Capital shares are held by
other directors or auditors who are currently in office;
furthermore, no shares are held in companies controlled by DeA Capital.
Directors Lorenzo Pellicioli, Marco Drago, Marco Boroli and Roberto Drago own shares of B&D Holding di Marco Drago e C.
S.a.p.a.
and, in the case of directors Marco Drago, Roberto Drago, Stefania
Boroli and Marco Boroli, shares of De Agostini S.p.A.,
which controls the Company both directly and indirectly, and are parties to a shareholders’ agreement covering these shares.
Stock options allocated to members of the boards of directors and auditors, general
managers and managers with strategic responsibilities
Details of stock options held by members of the boards of directors and auditors and by managers with strategic responsibilities
in DeA Capital S.p.A. and its subsidiaries are provided in aggregate format in the table below.
Options
Options held at
Options allocated
expired
Options held at
1 January 2014
during 2014
in 2014
31 December 2014
Average
Average
Average
No. exercise Average
No.
exercise Average
No.
No.
exercise Average
Beneficiary
Position
options
price
expiry options
price
expiry options options
price
expiry
Paolo Ceretti
CEO
630,000
1,3363
5
0
0
0 630,000
0
0
0
Paolo Ceretti
CEO
950,000
1,289
5
0 950,000
1,289
5
Paolo Ceretti
CEO
0
0
0 950,000
1,32
5
0 950,000
1,32
5
Senior managers
with strategic
responsibilities
400,000
1,3363
5
0
0
0 400,000
0
0
0
Senior managers
with strategic
responsibilities
600,000
1,289
5
0
0
0
0 600,000
1,289
5
Senior managers
with strategic
responsibilities
0
0
0 600,000
1,32
5
0 600,000
1,32
5
DeA Capital - Annual Financial Statements to 31 December 2014
131
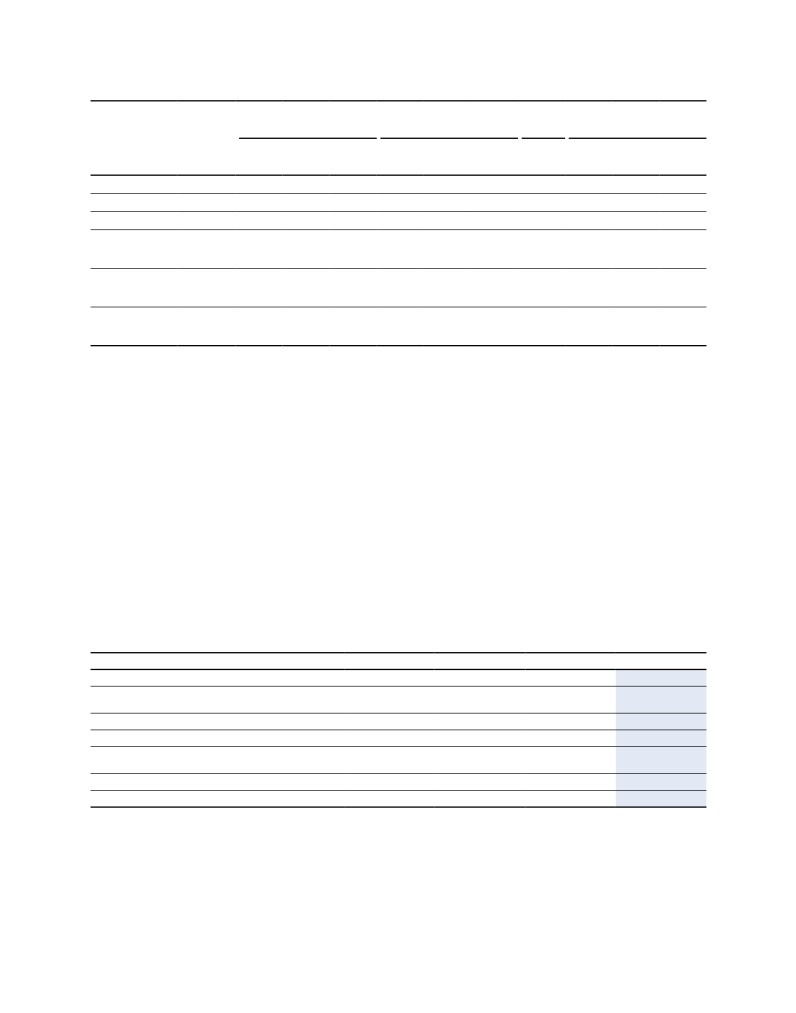
Lastly, note that the Chief Executive Officer, Paolo Ceretti, and managers with strategic responsibilities were assigned 120,000
and 84,625 performance shares respectively in 2014, as shown in the table below:
Options
Options held at
Options allocated
expired in
Options held at
1 January 2014
during 2014
2014
31 December 2014
Average
Average
Average
No. exercise Average
No.
exercise Average
No.
No.
exercise Average
Beneficiary
Position
options
price
expiry options
price
expiry options options
price
expiry
Paolo Ceretti
CEO
80,000
1,38
2
0
0
0
80,000
0
0
0
Paolo Ceretti
CEO
120,000
1,26
2
0
0
0
0 120,000
1,26
2
Paolo Ceretti
CEO
0
0
0 120,000
1,44
2
0 120,000
1,44
2
Senior managers
with strategic
responsibilities
52,500
1,38
2
0
0
0
52,500
0
0
0
Senior managers
with strategic
responsibilities
84,625
1,26
2
0
0
0
0
84,625
1,26
2
Senior managers
with strategic
responsibilities
0
0
0
84,625
1,44
2
0
84,625
1,44
2
Information on the fair value hierarchy
IFRS 13 stipulates that financial instruments reported at fair value should be classified based on a hierarchy that reflects the
importance and quality of the inputs
used in calculating fair value. Three levels have been determined:
• Level 1: includes quoted prices on active markets for assets or liabilities identical to those being valued;
• Level 2: includes observable inputs other than those included in level 1, for example:
- quoted prices on active markets for similar assets and liabilities;
- quoted prices on inactive markets for identical assets and liabilities;
- interest rate curves, implicit volatility, credit spreads;
• Level 3: unobservable data. These input data may be used if no observable input data are available. IFRS 13 specifies that
unobservable input data used to measure fair value must reflect the assumptions used by market participants when fixing the
price for the assets or liabilities being valued.
The table below shows assets valued at fair value by hierarchical level at 31 December 2014:
(EUR million)
Level 1
Level 2
Level 3
Total
Available-for-sale equity investments held by funds
17.5
53.7
71.2
Investments in associates and JVs held by Funds
(recognised on income statement)
39.8
39.8
Available-for-sale investments in other companies
209.1
0.2
209.3
Available-for-sale funds
8.4
168.3
176.7
Other available-for-sale financial assets -
non-current portion
0.3
0.3
Available-for-sale financial assets - current portion
5.1
5.1
Total assets
31.0
377.4
94.0
502.4
132 DeA Capital - Annual Financial Statements to 31 December 2014
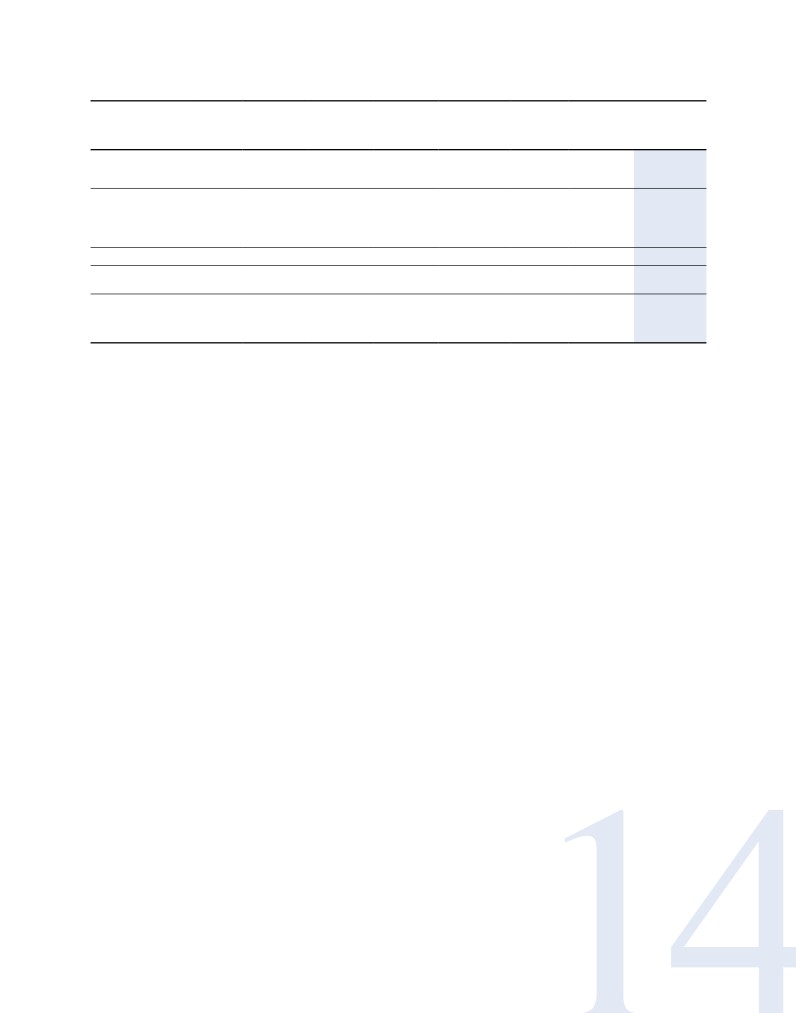
For level 3, a reconciliation of the opening and closing balances is shown in the table below. Income and expenses posted to the
Income Statement or shareholders’ equity, and purchases and sales made during 2014, are identified separately:
Impairment
Balance
and related
Fair value
at
exchange
Fair value
on income Translation
Balance at
(EUR thousand)
1.1.2014
Increases Decreases
effect
adjustment statement
effect
31.12.2014
Available-for-sale
equity investments
held by funds
58,400
375
0
(5,070)
0
0
0
53,705
Investments in
associates and
JVs held by Funds
(recognised on
income statement)
35,964
3,000
0
0
0
0
842
39,806
Other entities
184
0
0
0
0
0
0
184
Available-for-sale
investments
94,547
3,375
0
(5,070)
0
0
842
93,694
Other available-
for-sale financial
assets - non-
current portion
330
0
0
(24)
0
0
0
306
Valuation techniques and main unobservable input data
Kenan Investments / Migros
The shareholding in Kenan Investments (the indirect parent company of Migros) is recorded in the Consolidated Financial
Statements for the Year Ending 31 December 2014 at EUR 209.1 million.
The valuation of the shareholding in Kenan Investments at 31 December 2014, calculated on the basis of the percentage owned
by DeA Capital S.p.A., is based on a stock price of Migros, whose shares are listed on the Istanbul Stock Exchange, of:
(i) TRY 26.00 for the stake in Migros that is the subject of the transaction with Anadolu (described in the section ‘Significant
Events’ above), i.e. both the 40.25% of Migros shares being sold immediately and the 9.75% of Migros shares subject to put
and call options agreed by the parties);
(ii) TRY 22.75, being the market price on 31 December 2014, for the remaining stake (30.5% of Migros capital);
and, in addition to the exchange rate effect of TRY/EUR (2.83 at 31 December 2014), on an updated view of net debt at the
various levels of the Company’s control structure (Kenan Investments, Moonlight Capital, MH).
Venture capital funds, funds of funds, co-investment fund, theme funds and property funds
Valuations of shareholdings and funds in the portfolio reflect estimates made using the information available on the date this
document was prepared.
With regard to funds, at 31 December 2014, the DeA Capital Group held units in:
• seven venture capital funds (with a total value of approximately EUR 9.6 million);
• IDeA I FoF (valued at EUR 93.5 million);
• ICF II (valued at EUR 35.2 million);
• ICF III (valued at EUR 1.7 million);
• IDeA EESS (valued at EUR 4.3 million);
• IDeA ToI (value not significant);
• six unlisted property funds (with a total value of approximately EUR 32.4 million).
The carrying value of the funds represents the NAV advised by the management company in its annual report at 31 December
2014, drafted in accordance with the Bank of Italy’s regulation of 14 April 2005 on collective asset management, as amended
and supplemented by the Bank of Italy’s regulation of 8 May 2012.
DeA Capital - Annual Financial Statements to 31 December 2014
133

Main risks and uncertainties to which the Parent Company and consolidated Group
companies are exposed
As described in the Report on Operations, the DeA Capital Group operates through, and is structured as, two business areas,
Private Equity Investment and Alternative Asset Management.
The risks set out below take into account the features of the market and the operations of Parent Company DeA Capital S.p.A.
and the companies included in the Group’s Consolidated Financial Statements, the main findings of a risk assessment carried out
in 2014, as well as the periodic monitoring conducted partly through the regulatory policies adopted by the Group.
The Group has adopted a modern corporate governance system that provides effective management of the complexities of
its operations, and enables both individual companies and the Group to achieve their strategic objectives. Furthermore, the
assessments conducted by the organisational units and the directors confirm both the non-critical nature of these risks and
uncertainties and the financial solidity of the DeA Capital Group.
With reference to the specific risks relating to the main private equity investment, i.e. Migros, please see the Migros Annual
Report (available on the Migros website).
A. Contextual risks
A.1. Risks relating to general economic conditions
The operating performance and financial position of the DeA Capital Group are affected by the various factors that make up
the macro-economic environment in the countries in which the Group has invested, including GDP performance, investor and
consumer confidence, interest rates, inflation, the costs of raw materials and unemployment.
The ability to meet medium- to long-term objectives could be affected by general economic trends, which could slow the
development of sectors the Group has invested in, and at the same time, the business of the investee companies.
A.2. Socio-political events
In line with its own strategic growth guidelines, one of the DeA Capital Group’s activities is private equity investment
in companies and funds in different jurisdictions and countries around the world, which, in turn, invest in a number of
countries and geographical areas. The DeA Capital Group may have invested in foreign countries whose social, political and
economic conditions put the achievement of its investment objectives at risk.
A.3. Regulatory changes
Many Group companies conduct their operations in regulated sectors and markets. Any changes to or developments in the
legislative or regulatory framework that affect the costs and revenues structure of investee companies or the tax regime
applied could have negative effects on the Group’s financial results and necessitate changes to the Group’s strategy. To
combat this risk, the Group has established procedures to constantly monitor sector regulation and any changes thereto,
in order to take advantage of business opportunities and respond promptly to any changes in the prevailing legislation and
regulations.
A.4. Performance of the financial markets
The Company’s ability to meet its strategic and management objectives could depend on the performance of financial
markets. A negative trend in financial markets could have an effect on the Private Equity Investment sector in general,
making investment and divestment transactions more complex, and on the Group’s capacity to increase the NAV of
investments in particular. The value of shareholdings held directly or indirectly through funds in which the Company has
invested could be affected by factors such as comparable transactions concluded on the market, sector multiples and
market volatility. These factors that cannot be directly controlled by the Group are constantly monitored in order to identify
appropriate response strategies that involve both the provision of guidance for the management of Group companies, and
the investment and value enhancement strategy for the assets held.
134 DeA Capital - Annual Financial Statements to 31 December 2014

A.5. Exchange rates
Holding investments in currencies other than the euro exposes the Group to changes in exchange rates between currencies. The
investment in Kenan Investments is managed as a special case, since although it was made in euros, the underlying asset is
expressed
in Turkish lira. Taking into account the time horizon of the
investment, it is believed that the expected return on the
investment can absorb any devaluation of the underlying currency, if this is in line with the outlook for the currency.
A.6. Interest rates
Financing
operations that are subject to variable interest rates could expose the
Group to an increase in related financial charges,
in the event that the reference interest rates rise significantly.
B. Strategic risks
B.1. Concentration of the Private Equity Investment portfolio
The Private Equity Investment strategy adopted by the Group includes:
- Direct investments;
- Indirect investments (via funds).
Within this strategy, the Group’s overall profitability could be adversely affected by an unfavourable trend in one or a few
investments,
if there were insufficient risk diversification, resulting from the
excessive concentration of investment in a small
number of assets, sectors, countries, currencies, or of indirect investments in funds with limited investment targets/types of
investment.
To combat these risk scenarios, the Group pursues an asset allocation strategy intended to create a balanced portfolio with a
moderate
risk profile, investing in sectors and in companies with an appealing
current and future risk/return ratio. Furthermore,
the
combination of direct and indirect investments, which by their nature
provide a high level of diversification, helps reduce the
level of asset concentration.
B.2. Concentration of Alternative Asset Management activities
In the Alternative Asset Management business, events could arise as a result of excessive concentration and hinder
achievement of the level of expected returns. These events could be due to:
• Private equity funds
- concentration of the management activities of asset management companies across a limited number of funds, in the
event that the decision were made in respect of one or more funds to cancel the associated asset management mandate;
- concentration of the financial resources of the funds managed in a limited number of sectors and/or geographical areas,
in the event of currency, systemic or sector crises;
- for closed funds, the concentration of the commitment across just a few subscribers.
• Real estate funds
- concentration of real estate present in the portfolio of managed funds in a few cities and/or in limited types of property
(management/commercial), in the event of a crisis in the property market concerned;
- concentration in respect of certain major tenants, in the event that these withdraw from the rental contracts, which
could lead to a vacancy rate that has a negative impact on the funds' financial results and the valuation of the property
managed;
- concentration of the maturities of numerous real estate funds within a narrow timeframe, with related high availability of
property on the market, leading to a decrease in property values and an increase in selling times.
For each of the risk scenarios outlined above, the Group has defined and implemented appropriate strategies that include
strategic, operational and management aspects, as well as a system monitoring the level of diversification of Alternative
Asset Management activities.
DeA Capital - Annual Financial Statements to 31 December 2014
135

B.3. Key resources (governance/organisation)
The success of the DeA Capital Group depends to a large extent on its executive directors and certain key management figures,
their
ability to efficiently manage the business and the ordinary operations
of the Group, as well as knowledge of the market and
the professional relationships established. The departure of one or more of these key resources, without a suitable replacement
being found, as well as an inability to attract and retain new and qualified resources, could impact growth targets and have a
negative effect on the Group’s operating performance and financial results. To mitigate this risk, the Group has put in place HR
management policies that correspond closely to the needs of the business, and incentive policies that are periodically reviewed,
in light of, among other things, the general economic climate and the results achieved by the Group.
C. Operating risks
C.1. Investment operations
Investment operations conducted by the Group are subject to the risks typical of private equity activities, such as the accurate
valuation of the target company and the nature of the transactions carried out. The Group has implemented a structured process
of due diligence on target companies and the careful definition of shareholders’ agreements in order to conclude agreements in
line with the investment strategy and the risk profile defined by the Group.
C.2. Compliance with covenants
Some investment operations were concluded using financial leverage to invest in the target companies. For financing contracts
signed by investee companies, specific covenants generally backed by collateral are in place; failure to comply with these could
necessitate recapitalisation operations for investee companies and lead to an increase in financial charges relating to debt
refinancing. Failure to comply with covenants attached to loans could have negative effects on both the financial situation and
operations of investee companies, and on the value of the investment.
The Group constantly monitors the significant reference parameters for the financial obligations taken on by investee companies,
in order to identify any unexpected variance in good time.
C.3. Divestment operations
In its Private Equity Investment business, the Group generally invests over a medium-/long-term time horizon. Over the
investment management period, external situations could arise that might have a significant impact on the operating results
of the investee companies, and consequently on the value of the investment itself. Furthermore, in the case of co-investment,
guiding the management of an investee company could prove problematic or infeasible, and it may ultimately prove impossible
to
dispose of the stakes held owing to lock-up clauses. The divestment
strategy could therefore be negatively affected by various
factors, some of which cannot be foreseen at the time the investments are made. There is therefore no guarantee that expected
earnings will be realised, given the risks deriving from the investments made.
To combat these risk situations, the Group has defined a process to monitor the performance of its investee companies,
facilitated by its representation on the management bodies of significant investee companies, with a view to identifying any
critical situations in good time.
C.4. Funding Risk
The income flows expected from the Alternative Asset Management business depend on the capacity of the Group’s asset
management companies to stabilise/grow their assets under management. In this environment, fundraising activity could be
harmed
by both external factors, such as the continuation of the global
economic crisis or the trend in interest rates, and internal
factors, such as bad timing in respect of fundraising activities by the asset management companies, or the departure of key
managers from the companies. The Group has established appropriate risk management strategies in relation to fundraising,
with a view to both involving new investors and retaining current investors.
136 DeA Capital - Annual Financial Statements to 31 December 2014

Significant events after the reporting date for the 2014
Consolidated Financial Statements
After the end of 2014, the DeA Capital Group increased its investment in the IDeA I FoF, ICF II, ICF III, IDeA OF I, IDeA EESS
and AVA funds following total payments of EUR 9.2 million (EUR 5.2 million, EUR 1.5 million, EUR 0.1 million, EUR 0.3 million,
EUR 1.3 million and EUR 0.8 million respectively).
At the same time, the DeA Capital Group received capital reimbursements totalling EUR 15.2 million from the IDeA I FoF (EUR
13.6 million) and ICF II (EUR 1.6 million) funds, to be used in full to reduce the carrying value of the units.
Further information
Publication of the 2014 Financial Statements
In accordance with the provisions of IAS 10, the Parent Company authorised the publication of these Financial Statements within
the terms set by the laws in force.
Atypical or unusual transactions
In 2014, there were no atypical or unusual transactions as defined by Consob Communication 6064293 of 28 July 2006.
Significant non-recurring events and transactions
In 2014, the DeA Group did not undertake any significant non-recurring transactions as defined by the above-mentioned Consob
Communication.
DeA Capital - Annual Financial Statements to 31 December 2014
137


Statement of
responsibilities for the
consolidated financial
statements pursuant to
art. 154-bis of Legislative
Decree 58/98
DeA Capital - Annual Financial Statements to 31 December 2014
139

Statement of responsibilities for the Consolidated Financial
Statements pursuant to art. 154-bis of Legislative Decree 58/98
The undersigned, Paolo Ceretti, as Chief Executive Officer, and Manolo Santilli, as the manager responsible for preparing
the accounting statements of, hereby certify, pursuant to art. 154-bis, paragraphs 3 and 4 of Legislative Decree 58 of 24
February 1998, that based on the characteristics of the Company,
the administrative and accounting procedures for preparing the Consolidated Financial Statements during 2014 were
suitable and were effectively applied.
The assessment as to the suitability of the administrative and accounting procedures for preparing the Consolidated
Financial Statements for the Year Ending 31 December 2014 was based on a process established by DeA Capital S.p.A. in
keeping with the Internal Control - Integrated Framework model issued by the Committee of Sponsoring Organisations of
the Treadway Commission, which is the generally accepted reference framework at international level.
Note in this regard, that as described in the notes to the Annual Financial Statements, a significant portion of the assets
are investments stated at fair value. Fair values were determined by directors based on their best estimates and judgement
using the knowledge and evidence available at the time the Financial Statements were prepared. However, due to objective
difficulties in making assessments and the absence of a liquid market, the values assigned to such assets could differ, and in
some cases significantly, from those that could be obtained when the assets are sold.
The undersigned further certify that the Consolidated Financial Statements for the Year Ending 31 December 2014:
- correspond to the companies' accounting records;
- have been prepared in compliance with the International Financial Reporting Standards adopted by the European Union,
and the measures issued to implement art. 9 of Legislative Decree 38/2005;
- to the best of their knowledge, provide a true and fair view of the operating performance and financial position of the
issuer and the group of companies included in the basis of consolidation.
The Report on Operations contains a reliable analysis of operating performance and results and of the position of the issuer
and all companies included in the basis of consolidation, together with a description of the main risks and uncertainties to
which they are exposed.
12 March 2015
Paolo Ceretti
Manolo Santilli
Chief Executive Officer
Manager responsible for preparing
the Company’s accounts
140 DeA Capital - Statement of responsibilities for the consolidated financial statements

Information pursuant to art. 149-duodecies of the Consob
Issuer Regulations
The table below was prepared in accordance with art. 149-duodecies of the Consob Issuer Regulations and reports the fees for
2014 for auditing and other services provided by the independent auditors and entities belonging to the independent auditors’
network. The fees reported below do not include VAT and out-of-pocket expenses.
Party that provided
Compensation
(Euro thousand)
the service
Recipient
for 2014
Audit
KPMG S.p.A.
DeA Capital S.p.A.
98
KPMG S.p.A.
DeA Capital Real Estate
36
KPMG S.p.A.
Innovation Real Estate
24
KPMG S.p.A.
IRE Advisory
11
KPMG S.p.A.
IDeA Capital Funds SGR
12
KPMG S.p.A.
IDeA FIMIT SGR
16
Certification services (1)
KPMG S.p.A.
DeA Capital S.p.A.
7
KPMG S.p.A.
DeA Capital Real Estate
3
KPMG S.p.A.
Innovation Real Estate
1
KPMG S.p.A.
IRE Advisory
1
KPMG S.p.A.
IDeA Capital Funds SGR
3
Other services
KPMG Advisory S.p.A.
IDeA FIMIT SGR
290
Total
502
1) Single model subscription/770
DeA Capital - Annual Financial Statements to 31 December 2014
141


Annual Financial Statements
for DeA Capital S.p.A.
for the period 1 January
to 31 December 2014
• Statement of Financial Position
• Income Statement
• Statement of Comprehensive Income
• Cash Flow Statement
• Statement of Changes in
Shareholders’ Equity
• Notes to the Accounts
DeA Capital - Annual financial statements for the year ending 31 December 2014
143
Statement of Financial Position-DeA Capital S.p.A.
(Euro thousand)
Note
31.12.2014
31.12.2013
ASSETS
Non-current assets
Intangible and tangible assets
Intangible assets
1a
13,609
7,183
Tangible assets
1b
586,918
804,965
Total intangible and tangible assets
600,527
812,148
Investments
Subsidiaries and joint ventures
256,900,010
592,580,468
Associates
14,221,021
0
Available-for-sale investments
209,320,028
184,443
Available-for-sale funds
144,383,615
133,146,396
Total Investments
624,824,674
725,911,307
Other non-current assets
Deferred tax assets
3a
0
0
Tax receivables from Parent companies
3b
546,152
2,983,813
Total other non-current assets
546,152
2,983,813
Total non-current assets
625,971,353
729,707,268
Current assets
Trade receivables
4a
557,069
646,711
Financial receivables
4b
1,709,552
42,549,349
Tax receivables from Parent companies
4c
2,782,826
3,106,824
Other tax receivables
4d
115,044
558,488
Other tax receivables
4e
289,382
778,432
Other receivables
4f
538,818
524,323
Cash and cash equivalents
4g
37,961,858
3,776,078
Total current assets
43,954,549
51,940,205
Total current assets
43,954,549
51,940,205
Held-for-sale assets
5
0
1,285,190
TOTAL ASSETS
669,925,902
782,932,663
SHAREHOLDERS' EQUITY AND LIABILITIES
SHAREHOLDERS' EQUITY
Share capital
6a
271,626,364
273,975,096
Share premium reserve
6b
384,826,924
386,197,724
Legal reserve
6c
61,322,420
61,322,420
Fair Value reserve
6d
12,908,007
(20,456,795)
Other reserves
6e
504,126
462,873
Retained earnings (losses)
6f
(71,451,400)
(8,585,197)
Profit/(loss) for the year
6g
(4,519,219)
(62,866,203)
Shareholders' equity
655,217,222
630,049,918
LIABILITIES
Non-current liabilities
Deferred tax liabilities
3a
0
0
Provisions for employee termination benefits
7a
558,957
384,413
Long term financial loans
7b
0
122,206,023
Other payables
7c
11,396,404
0
Total non-current liabilities
11,955,361
122,590,436
Current liabilities
Trade payables
8a
1,325,359
1,859,878
Payables to staff and social security organisations
8b
828,943
859,470
Current tax payables
8c
63,926
63,926
VAT payables vs Parent companies
8d
339,690
0
Other tax payables
8e
184,324
184,763
Other payables
8f
11,077
975
Short term financial loans
8g
0
27,323,297
Total current liabilities
2,753,319
30,292,309
Held-for-sale liabilities
0
0
TOTAL SHAREHOLDERS' EQUITY AND LIABILITIES
669,925,902
782,932,663
144 DeA Capital - Annual financial statements for the year ending 31 December 2014
Income Statement-DeA Capital S.p.A.
(Euro)
Note
Year 2014
Year 2013
Gains from subsidiaries
0
0
Dividendi da Società Controllate e altri proventi
9a
190,476,720
134,468,235
Dividends from subsidiaries and joint ventures
9a
297,735
373,087
Gains from available-for-sale funds
9a
(192,148,356)
(194,284,007)
Impairment of associated
9a
(884,208)
0
Impairment of Investments in other companies-available-for-sale
9a
(65,190)
(188,495)
Available for sale impairment
9a
(1,317,382)
(1,348,369)
Income from services
9b
1,868,506
1,132,082
Other income
9c
252,730
171,624
Personnel costs
10a
(4,978,154)
(1,315,866)
Service costs
10b
(4,818,879)
(4,110,260)
Depreciation, amortization and impairment
10c
(154,567)
(156,169)
Other expenses
10d
(444,042)
(213,492)
Financial income
11a
3,173,521
3,646,797
Financial expenses
11b
(3,443,143)
(4,775,564)
PROFIT/(LOSS) BEFORE TAX
(12,184,709)
(66,600,397)
Income tax
12a
908,140
2,926,467
Deferred tax
12b
6,757,350
807,727
PROFIT/(LOSS) FOR THE YEAR FROM
CONTINUING OPERATIONS
(4,519,219)
(62,866,203)
Profit (Loss) from discontinued operations/held-for-sale assets
0
0
PROFIT/(LOSS) FOR THE YEAR
(4,519,219)
(62,866,203)
Earnings per share, basic (€)
13
(0.02)
(0.23)
Earnings per share, diluted (€)
13
(0.02)
(0.23)
Pursuant to Consob Resolution 15519 of 27 July 2006, the impact of dealings with related parties on the Statement of Financial
Position, Income Statement and Cash Flow Statement is explained in the notes to the Financial Statements.
DeA Capital - Annual financial statements for the year ending 31 December 2014
145
Statement of Comprehensive Income
(Statement of Performance - IAS 1)
Comprehensive income or the Statement of Performance (IAS 1), in which performance for the year is reported including
results posted directly to shareholders’ equity, reflects a net positive balance of approximately EUR 28,765 thousand compared
with a net negative balance of around EUR 109,442 thousand in 2013.
(in EUR)
31.12.2014
31.12.2013
Profit/(loss) for the year (A)
(4,519,219)
(62,866,203)
Components that may be subsequently restated under profit/(loss) for the year
33,364,802
(46,544,859)
Gains/(losses) from recalculation of available-for-sale financial assets
33,364,802
(46,544,859)
Components that will not be subsequently restated under profit/(loss) for the year
(80,598)
(30,893)
Actuarial gains/(losses) to be revalued in defined benefit plans
(80,598)
(30,893)
Total other profit/(loss), net of tax effect (B)
33,284,204
(46,575,752)
Total comprehensive profit/(loss) for the year (A)+(B)
28,764,985
(109,441,955)
146 DeA Capital - Annual financial statements for the year ending 31 December 2014
Cash flow statement - Parent Company - Direct method
Financial year
Financial year
(EUR thousand)
2014
2013
CASH FLOW from operating activities
Investments in funds and shareholdings
(18,108)
(52,171)
Proceeds from the sale of investments
1,220
81
Capital reimbursements from funds and shareholdings
29,601
8,866
Interest received
24
79
Intragroup interest received
1,111
618
Interest paid
(3,073)
(2,515)
Intragroup interest paid
(152)
0
Income from distribution from investments
298
0
Realised gains (losses) on exchange rate derivatives
0
(827)
Exchange gains (losses)
5
(4)
Taxes paid
(3)
(16)
Taxes refunded
3,689
4,379
Dividends received
131,557
13,880
Revenues for services
369
252
Intragroup revenues for services
2,777
2,982
Intragroup operating expenses
(1,409)
(803)
Operating expenses - cash movements
0
0
Operating expenses
(8,870)
(8,260)
Net cash flow from operations
139,036
(33,459)
CASH FLOW from investment activities
Acquisition of property, plant and equipment
(316)
(3,454)
Sale of property, plant and equipment
0
729
Acquisition of intangible assets
(13)
(7)
Sale of property, plant and equipment ICO
45
2,399
Net cash flow from investments
(284)
(333)
CASH FLOW from financial activities
Acquisition of financial assets
0
0
Sale of financial assets
0
270
Share capital issued
0
0
Share capital issued for stock option plan
0
0
Purchase of own shares
(3,719)
(885)
Own shares sold
0
0
Warrants
0
0
Bank loan repayments
0
0
Bank loans
(147,000)
47,000
Short-term intragroup loans
45,398
(10,971)
Medium-/long-term iintragroup loans
0
0
Increase in equity investments
0
0
Net cash flow from financial activities
(105,321)
35,414
NET INCREASE IN CASH AND CASH EQUIVALENTS
33,430
1,622
CASH AND CASH EQUIVALENTS AT BEGINNING OF PERIOD
3,776
2,154
Initial cash and cash equivalents of companies merged in the period
756
0
Cash and cash equivalents of assets at beginning of period
4,532
2,154
EXCHANGE EFFECT OF CASH AND CASH EQUIVALENTS IN FOREIGN CURRENCY
0
0
CASH AND CASH EQUIVALENTS AT END OF PERIOD
37,962
3,776
Held-for-sale assets
0
0
CASH AND CASH EQUIVALENTS AT END OF PERIOD
37,962
3,776
DeA Capital - Annual financial statements for the year ending 31 December 2014
147

Statement of changes in shareholders’ equity
of the Parent Company DeA Capital SpA
Share
Stock
Share
premium
Legal Fair value
option
(EUR thousand)
capital
reserve
reserve
reserves
reserve
Total at 31.12.2012
274,606
386,452
61,322
26,088
919
Allocation of profit
0
0
0
0
0
Cost of stock options
0
0
0
0
(7)
Purchase of own shares
(631)
(254)
0
0
0
Total comprehensive profit/(loss) for 2013
0
0
0
(46,545)
0
Total at 31.12.2013
273,975
386,198
61,322
(20,457)
912
Allocation of profit
0
0
0
0
0
Cost of stock options
0
0
0
0
121
Purchase of own shares
(2,349)
(1,371)
0
0
0
Total comprehensive profit/(loss) for 2014
0
0
0
33,365
0
Total al 31.12.2014
271,626
384,827
61,322
12,908
1,033
Pursuant to Consob Resolution 15519 of 27 July 2006, the impact of dealings with related parties on the Statement of Financial
Position, Income Statement and Cash Flow Statement is explained in the notes to the Financial Statements.
148 DeA Capital - Annual financial statements for the year ending 31 December 2014
Reserve for
Reserve for
Profit/(loss)
Reserve for sale
the IDeA
actuarial gains
carried
Profit/
of option rights
AI merger
/ losses
forward
(loss)
Total
413
(831)
0
(10,854)
2,269
740,384
0
0
0
2,269
(2,269)
0
0
0
0
0
0
(7)
0
0
0
0
0
(885)
0
0
(31)
0
(62,866)
(109,442)
413
(831)
(31)
(8,585)
(62,866)
630,050
0
0
0
(62,866)
62,866
0
0
0
0
0
0
121
0
0
0
0
0
(3,720)
0
0
(80)
0
(4,519)
28,766
413
(831)
(111)
(71,451)
(4,519)
655,217
DeA Capital - Annual financial statements for the year ending 31 December 2014
149


Notes to the Accounts
Annual Financial
Statements for the Year
Ending 31 December 2014
DeA Capital - Annual financial statements for the year ending 31 December 2014
151

Notes to the Accounts
Annual Financial Statements for the Year Ending 31 December 2014
A. Structure and content of the Financial Statements
DeA Capital S.p.A. (hereinafter also the Company or the Parent Company or DeA Capital) is a company limited by shares with
its registered office in Via Brera 21, Milan.
On 14 November 2014, the Luxembourg company DeA Capital Investments S.A., a wholly-owned subsidiary, was merged into
the Company and, at the same time a Luxembourg branch was opened as a secondary office.
The Financial Statements were prepared in accordance with the general principles of IAS 1, specifically:
- the matching principle: the effect of events and transactions is recorded when they occur, and not when payment is made or
received;
- the going concern principle: the Financial Statements are prepared under the assumption that business operations will
continue for the foreseeable future. In this regard, the directors have evaluated this assumption with particular scrutiny in
light of the current economic and financial crisis. As indicated in the section ‘Uncertainties and the management of financial
risks’ in the Report on Operations, the directors believe that the risks and uncertainties described therein are not critical in
nature, confirming the financial solidity of the Parent Company, DeA Capital S.p.A.;
- materiality: when reporting operating events in accounting entries, preference is given to the principle of economic substance
over form;
- comparative information: the Financial Statements must show comparative information for the previous period.
The DeA Capital Financial Statements consist of the Statement of Financial Position, the Income Statement, the Statement
of Comprehensive Income (Statement of Performance - IAS 1), the Cash Flow Statement, the Statement of Changes in
Shareholders’ Equity and these Notes to the Financial Statements.
The Statement of Financial Position provides a breakdown of current and non-current assets and liabilities with separate
reporting for those resulting from discontinued or held-for-sale operations.
In the Income Statement, the Company has adopted the nature of expense method, whereby costs and revenues are classified
according to type.
The Cash Flow Statement is prepared using the “direct method”.
Unless otherwise indicated, all tables and figures included in these notes to the Financial Statements are reported in EUR
thousand.
As Parent Company, DeA Capital S.p.A. has also prepared the Consolidated Financial Statements for the DeA Capital Group for
the Year Ending 31 December 2014.
In addition to the figures at 31 December 2014, the Financial Statement formats used also provide comparable figures for 31
December 2013.
The publication of the draft Financial Statements for the Year Ending 31 December 2014 was authorised by resolution of the
Board of Directors dated 12 March 2015.
Statement of compliance with accounting standards
The Financial Statements for the Year Ending 31 December 2014 (2014 Financial Statements) have been prepared in
accordance with the International Accounting Standards adopted by the European Union and approved by the date the
Financial Statements were prepared (International Accounting Standards, or individually IAS/IFRS, or collectively IFRS
(International Financial Reporting Standards)). “IFRS” also means all interpretations of the International Financial Reporting
Interpretations Committee (IFRIC), including those previously issued by the Standing Interpretations Committee (SIC), and
approved by the European Union.
152 DeA Capital - Notes to the financial statements

The Financial Statements were prepared with a focus on clarity, and provide a true and fair view of the assets, financial
situation, operating results and cash flows for the period.
Accounting standards, amendments and interpretations applied as of 1 January 2014
The IASB-approved international accounting standards and interpretations authorised for adoption in Europe that were applied
for the first time from 1 January 2014 are detailed below. None of these had a significant impact on the Financial Statements
for the Year Ending 31 December 2014. The Company did not apply any IFRS in advance.
IFRS 10 (Consolidated Financial Statements)
On 12 May 2011, the IASB published the accounting standard IFRS 10 (Consolidated financial statements), which is intended
to replace IAS 27 (Consolidated and separate financial statements) and SIC 12 (Consolidation - special purpose entities).
The
new standard sets out a single model of consolidation that identifies
control as the basis for the consolidation of all types
of entities.
The new standard defines the concept of control on the basis of the concurrence of three essential elements:
• power over the investee company;
• exposure to or the right to variable returns from its involvement with the investee company;
• the ability to use that power over the investee to affect the amount of the investor’s returns.
IFRS 11 (Joint arrangements)
On 12 May 2011, the IASB published the accounting standard IFRS 11 (Joint arrangements), which is intended to replace IAS
31 (Interests in joint ventures) and SIC 13 (Jointly controlled entities - non-monetary contributions by venturers). The new
standard governs the principles for reporting all joint arrangements. These are divided into two categories, according to the
economic substance of the arrangements between the parties:
• joint operations, whereby the parties to the arrangement acquire rights to certain assets and assume obligations for certain
liabilities;
• joint ventures, whereby the parties have rights to the net value of a set of jointly controlled assets and liabilities.
In the first case, the investor recognises the assets and liabilities acquired (along with the associated income and expenses)
according to the IAS/IFRS standards governing the individual elements; in the second, the pro-rata interest in the joint
venture is recognised using the equity method.
IFRS 12 (Disclosure of interests in other entities)
On 12 May 2011, the IASB published the accounting standard IFRS 12 (Disclosure of interests in other entities) regarding the
information
to be provided in the financial statements on interests in other
entities, including subsidiaries, associates and joint
ventures. This information must enable users of the financial statements to understand the nature of the risks associated with
the investments in strategic shareholdings that will form part of the company’s assets over the long term. The information must
also indicate the effects of these investments on the assets, financial position, operating result and cash flows.
Amendments to IAS 32 (Offsetting financial assets and financial liabilities)
On 16 December 2011, the IASB published a number of amendments to IAS 32 (Financial instruments: presentation),
clarifying how certain criteria for offsetting financial assets and liabilities, as set out in IAS 32, should be applied.
Transition Guidance (Amendments to IFRS 10, IFRS 11 and IFRS 12)
On 28 June 2012, the IASB published “Consolidated Financial Statements, Joint Arrangements and Disclosure of Interests in
Other Entities: Transition Guidance (Amendments to IFRS 10, IFRS 11 and IFRS 12)”.
Investment Entities (Amendments to IFRS 10, IFRS 12 and IAS 27)
On 31 October 2012, the IASB published “Investment Entities (Amendments to IFRS 10, IFRS 12 and IAS 27)”. The change
introduced an exception to IFRS 10, which stipulates that investment entities should value certain subsidiaries at fair value on
the income statement instead of consolidating them.
DeA Capital - Annual financial statements for the year ending 31 December 2014
153

Recoverable Amount Disclosures for Non-Financial Assets (Amendments to IAS 36)
On 29 May 2013, the IASB published the document “Recoverable Amount Disclosures for Non-Financial Assets”. This clarifies
that the disclosure to be made concerning the recoverable value of assets that have undergone a fall in value only concerns
those assets whose recoverable value is based on fair value net of sales costs.
Future accounting standards, amendments and interpretations
Accounting standards, amendments and interpretations that are not yet applicable and have not been
adopted in advance by the Company, but were approved for adoption in the European Union as of
28 February 2015
The International Accounting Standards, together with the interpretations and changes to existing IASB-approved accounting
standards and interpretations that were ratified for adoption in the European Union on 28 February 2015, are as follows:
IFRIC 21 - Levies
On 20 May 2013, the IASB published the interpretation “IFRIC 21 - Levies”, to describe the accounting of levies imposed by
the tax authorities, as well as current taxes. The interpretation deals with the issue of recognising costs that companies must
sustain for tax payments. IFRIC 21 is an interpretation of IAS 37 (Provisions, Contingent Liabilities and Contingent Assets).
IFRIC 21 applies to financial periods commencing on or after 17 June 2014.
IAS 19 - Employee benefits
On 21 November 2013, the IASB published some minor amendments to IAS 19 (Employee benefits), entitled “Defined benefit
plans: employee contributions”. The amendments simplify the accounting requirements for contributions to defined benefit
plans from employees or, in certain cases, third parties.
The amendments are applicable retrospectively for financial periods starting from 1 July 2014, but may be applied in advance.
Improvements to IFRS - 2010-2012 and 2011-2013 cycles
On 12 December 2013, the IASB issued a set of amendments to the IFRS (“Annual Improvements to IFRS - 2010-2012 Cycle”
and “Annual Improvements to IFRS - 2011-2013 Cycle”). The most important issues dealt with in these amendments were:
- the amendments to the definitions of vesting conditions and market conditions as well as to the definitions of performance
conditions and service conditions (previously included in the definition of vesting conditions) in IFRS 2 (Share-based
payment);
- information on estimates and assessments used in aggregating operating segments in IFRS 8 (Operating segments);
- the identification and disclosure of a transaction with a related party that arises when a management entity provides key
management personnel services to the company that prepares the accounts in IAS 24 (Related party transactions);
- the exclusion of all types of joint arrangements from the scope of application of IFRS 3 (Business combinations).
These amendments take effect for annual periods starting from 1 July 2014, but can be applied in advance.
We do not anticipate that any adoption of the standards and interpretations noted above will have a material impact on the
valuation of the Company’s assets, liabilities, costs and revenues.
Accounting principles, amendments and interpretations that are not yet applicable, have not been
adopted in advance by the Company and are not yet approved for adoption in the European
Union as of 28 February 2015
The International Accounting Standards, interpretations and amendments to existing IASB-approved accounting standards and
interpretations that had not been ratified for adoption in the European Union as of 28 February 2015 are as follows:
154 DeA Capital - Notes to the financial statements

IFRS 9 (Financial instruments)
On 12 November 2009, the IASB published the first part of IFRS 9 (Financial instruments). It was subsequently reissued
in October 2010 and amended in November 2013. The standard, which introduces changes to both the recognition and
the measurement of financial assets and liabilities, and hedge accounting, will fully replace IAS 39 (Financial instruments:
recognition and measurement).
The standard, which is awaiting ratification by the European Commission, will come into force on 1 January 2018, but can be
applied in advance.
IFRS 14 (Regulatory Deferral Accounts)
On 30 January 2014, the IASB published IFRS 14 (Regulatory Deferral Accounts), which allows only those adopting the IFRS
for the first time to continue to report amounts relating to rate regulation according to the previously adopted accounting
standards. In order to improve comparability with companies that already apply the IFRS and that do not report these
amounts, the standard requires the effect of rate regulation to be presented separately from other items.
The standard, which is awaiting ratification by the European Commission, will come into force on 1 January 2016, but can be
applied in advance.
Amendments to IFRS 11 (Joint arrangements)
On 6 May 2014, the IASB issued some amendments to IFRS 11 (Joint arrangements: accounting for acquisitions of interests in
joint operations) to clarify the accounting requirements for acquisitions in joint operations that constitute a business.
The amendments are applicable retrospectively for annual periods starting from 1 January 2016, but can be applied in advance.
Amendments to IAS 16 (Property, plant and equipment), and to IAS 38 (Intangible assets)
On 12 May 2014, the IASB issued an amendment to IAS 16 (Property, plant and equipment) and to IAS 38 (Intangible assets).
The IASB clarified that the use of revenue-based methods to calculate the depreciation of an asset is not appropriate because
revenue generated by an activity that includes the use of an asset generally reflects factors other than the consumption of the
economic benefits embodied in the asset. The IASB also clarified that revenue is generally presumed to be an appropriate basis
for measuring the consumption of the economic benefits embodied in an intangible asset. This presumption, however, can be
rebutted in certain limited circumstances.
These amendments take effect for annual periods starting from 1 January 2016, but can be applied in advance.
IFRS 15 (Revenue from contracts with customers)
On 28 May 2014, the IASB issued IFRS 15 (Revenue from contracts with customers). The standard replaces IAS 18 (Revenue),
IAS 11 (Construction contracts), and the interpretations SIC 31, IFRIC 13 and IFRIC 15, and requires revenues reported when
the
control of assets or services is transferred to clients to reflect the
amount that is expected to be received in exchange for
these goods and services.
The new model for reporting revenues has five steps for recognising revenue from contracts with customers:
- identifying contracts with the customer;
- identifying performance obligations, i.e. contractual commitments to transfer goods or services to a customer;
- determining the transaction price;
- allocating transaction prices to performance obligations;
- reporting the revenues when the relevant performance obligation has been fulfilled.
The standard is applicable for annual periods starting after 1 January 2017, and must be fully or partially applied
retrospectively.
DeA Capital - Annual financial statements for the year ending 31 December 2014
155

Amendments to IAS 27 (Equity Method in Separate Financial Statements)
On 12 August 2014, the IASB issued an amendment - “Equity Method in Separate Financial Statements” - to IAS 27.
The objective of the amendment to IAS 27 is to allow parent companies to use the equity method to account for investments
in associate companies and joint ventures in the separate financial statements.
The amendments, which are awaiting ratification by the European Commission, will come into force on 1 January 2016, but
can be applied in advance.
Improvements to IFRS - 2012-2014 cycle
On 25 September 2014, the IASB issued a set of amendments to IFRSs (Annual Improvements to IFRSs - 2012-2014 Cycle). The
most important issues dealt with in these amendments were:
- the amendment that introduces some specific guidance to IFRS 5 for cases in which an entity reassigns an asset from the held-
for-sale
category to the held-for-distribution category (or vice versa), or when
the requirements for classifying an asset as held-
for-distribution
are not met. The amendments specify that these reclassifications should
not be considered as a change to a sales
plan or to a distribution plan and that the criteria for classification and valuation remain valid;
-
as regards IFRS 7, the amendment covers the introduction of further
guidance to clarify whether a servicing contract constitutes
a continuing involvement in a transferred asset for the purposes of transfer disclosure requirements;
- the amendment introduced in IAS 19 clarifying that the high quality corporate bonds used to determine the discount rate for
post-employment benefits should be issued in the same currency in which the benefits are paid;
- the amendments to IAS 34 to clarify the requirements if the requested information is presented in the interim financial report
but not in the interim financial statements.
The amendments, which are awaiting ratification by the European Commission, will come into force on 1 January 2016, but can be
applied in advance.
Amendments to IAS 1 (Disclosure Initiative)
On 18 December 2014, the IASB issued an amendment - “Disclosure Initiative” - to IAS 1.
The most important issues dealt with in these amendments were:
- clarification that the items on the statement of financial position, the income statement and the statement of comprehensive
income can be disaggregated or aggregated depending on their materiality;
- clarification that the OCI stake in an associate company or joint venture is presented as a single item, independently of its
subsequent recycling in the income statement.
The amendment, which is awaiting ratification by the European Commission, will come into force on 1 January 2016, but can be
applied in advance.
Amendments to IFRS 10, IFRS 12 and IAS 28 (Investment Entities - Applying the Consolidation
Exception)
On 18 December 2014, the IASB issued the amendment - “Investment Entities: Applying the Consolidation Exception
(amendments to IFRS 10, IFRS 12 and IAS 28)” with the objective of clarifying issues relating to the consolidation of an
investment entity. More specifically the amendment to IFRS 10 specifies that a parent company (an intermediate parent, i.e. not
an
investment entity), in turn a subsidiary of an investment entity, is
not obliged to prepare consolidated financial statements,
even if the investment entity measures subsidiaries at fair value, in accordance with IFRS 10. Prior to this amendment, under
IFRS 10 a parent company was not obliged to present consolidated financial statements on condition that its parent company draft
consolidated financial statements that comply with IFRS. Following this amendment, the exemption from preparing consolidated
financial
statements has been extended to intermediate parents which in turn are
subsidiaries of an investment entity, even if the
latter values its subsidiaries at fair value rather than consolidating them.
The amendment, which is awaiting ratification by the European Commission, will come into force on 1 January 2016, but can be
applied in advance.
Amendments to IFRIC 10 and IAS 28 (Sale or Contribution of Assets between an Investor and its
Associate or Joint Venture)
On 11 September 2014, the IASB published the document “Sale or Contribution of Assets between an Investor and its Associate or
Joint Venture (Amendments to IFRS 10 and IAS 28)”.
The objective of the amendments is to clarify accounting treatment, both in the event of a parent losing control of a subsidiary
156 DeA Capital - Notes to the financial statements

(governed by IFRS 10) and in the case of downstream transactions (governed by IAS 28), according to whether or not the object of
the
transaction is a business, as defined by IFRS 3. If the object of the
transaction is a business, the profit must be reported in full
in
both the above cases, whereas if the object of the transaction is not a
business, the profit must be reported only for the portion
relating to minority interests.
The Company will adopt these new standards, amendments and interpretations based on the stipulated date of application, and will
assess their potential impact when they have been ratified by the European Union.
B. Most important accounting principles and valuation criteria
The accounting principles and valuation criteria adopted for the 2014 Annual Financial Statements of DeA Capital are the
same as those used in drawing up the Consolidated Financial Statements, with the exception of specific principles and criteria
relating to the Consolidated Financial Statements and methods for valuing subsidiaries and joint ventures, as specified below.
Investments in subsidiaries and joint ventures are classified as available-for-sale assets and are measured at fair value with
appropriate reserves of shareholders’ equity as a balancing entry.
Current and non-current assets and liabilities
An asset is considered current if it meets at least one of the following conditions:
• it is expected to be converted during the company’s normal operating cycle. The “company’s operating cycle” means the
period from the acquisition of an asset to its conversion to cash and cash equivalents. When the company’s operating cycle
cannot be clearly identified, its duration is assumed to be twelve months;
• it is held mainly for trading purposes;
• its conversion is expected to occur within 12 months following the end of the financial year;
•
it consists of cash and cash equivalents which have no restrictions
that would limit its use in the twelve months following the
end of the financial year.
All other assets are carefully analysed to separate the “current” portion from the “non-current” portion.
Furthermore, deferred tax assets are recorded under non-current components.
A liability is considered current if it meets at least one of the following conditions:
• it is expected to be settled during the company’s normal operating cycle;
• it is held mainly for trading purposes;
• its settlement is expected to occur within 12 months following the end of the financial year;
• the company does not have an unconditional right to defer payment of the liability for at least 12 months following the end
of the financial year.
All other liabilities are carefully analysed to separate the “current portion” from the “non-current” portion.
Furthermore, deferred tax liabilities are recorded under non-current components.
Intangible assets
Intangible assets are those assets with no identifiable physical form that are controlled by the company and produce future
economic benefits. They are recorded under assets when it is likely that their use will generate future economic benefits and
when their cost can be reliably determined. The above assets are recorded at purchase cost, or at production cost if they are
generated internally.
The purchase cost is represented by the fair value of the price paid to acquire the asset and by all other direct costs incurred
to prepare the asset for use.
The carrying value of intangible assets is maintained in the Financial Statements to the extent that there is evidence that this
value can be recovered through use or if it is likely that these assets will generate future economic benefits.
DeA Capital - Annual financial statements for the year ending 31 December 2014
157

The useful life of intangible assets is assessed as finite or indefinite.
Intangible assets with an indefinite useful life are tested to check that their value is still appropriate whenever there are
indications of possible impairment, as required by IAS 36 (Impairment of assets). Intangible assets with an indefinite useful
life are not amortised. The useful life of an intangible asset with an indefinite life is reviewed annually to check that the
underlying conditions for the classification continue to apply.
Intangible
assets with a finite useful life are amortised on a straight-line basis
over their expected useful life. The useful life
of these intangible assets is tested to check that their value is still appropriate whenever there are indications of possible
impairment.
Tangible assets
Tangible assets are recorded at purchase price or production cost adjusted for accumulated depreciation and any impairment.
Their cost includes ancillary costs and direct and indirect costs incurred at the time of purchase necessary to make the asset
usable. The purchase cost is represented by the fair value of the price paid to acquire the asset and by all other direct costs
incurred
to prepare the asset for use. Tangible assets are depreciated on a
straight-line basis over their remaining useful life,
using
the depreciation rates indicated in the notes on the item relating to
similar groups of assets. If factors are discovered that
lead the Company to believe that it may be difficult to recover the net carrying value, an impairment test is performed. If the
reasons for the impairment cease to exist, the carrying value of the asset is increased to its recoverable amount.
Impairment
Impairment always occurs when the carrying value of an asset is greater than its recoverable value. On each reporting date,
the company determines whether there are any indications that an asset may be impaired. If such indications exist, the
recoverable value of the asset is estimated (impairment test) and any write-down is recorded. The recoverable value of an
asset is the higher of its fair value less costs to sell the asset and its value in use.
IAS 36 provides instructions on determining fair value less costs to sell an asset, as follows:
• if there is a binding sales agreement, the asset’s fair value is the negotiated price;
•
if there is no agreement, but the asset is marketed in an active
market, the fair value is the current bid price (thus, the exact
price on the value date and not the average price);
• if no prices can be found in active markets, fair value must be determined based on valuation methods that incorporate the
best information available including any recent transactions involving the same asset, after verifying that there were no
significant changes in the economic environment between the date of the transactions under consideration and the valuation
date.
IAS 36 defines value in use as the present value of future cash flows that an asset is projected to produce. The estimate of the
value in use must include the items listed below:
• an estimate of future cash flows that the company expects to derive from the asset;
• expectations of potential changes in value and the timing of such cash flows;
• the time value of money;
• other factors such as the volatility of the asset’s value and the lack of a liquid market for it.
For more information on determining value in use, please see Appendix A of IAS 36. However, the main elements for
accurately estimating the value in use are an appropriate calculation of projected cash flows (for which the investee company’s
business plan is essential) and their timing, as well as the application of the right discount rate that accounts for both the
present value of money and the specific risk factors for the asset to be valued.
In all cases, when calculating the value it is important to:
• base cash flow projections on reasonable and sustainable assumptions that provide the best estimate of the economic
conditions that are likely to exist over the remaining useful life of the asset;
• base cash flow projections on the most recent budget/plan approved by the investee company, which, however, must
exclude any future inflows or outflows of cash that are expected to come from the future restructuring, improvement or
optimisation of operating performance. Projections based on these budgets/plans must cover a maximum period of five
years unless a longer period of time can be justified;
158 DeA Capital - Notes to the financial statements

• estimate higher cash flow projections for the period covered by the most recent budgets/plans by extrapolating projections
based on the budgets/plans taken into consideration, and using a stable or declining growth rate for subsequent years
unless a rising rate can be justified. This growth rate must not exceed the average long-term growth rate for production in
the country or countries in which the investee company operates or for markets in which the asset used is placed unless a
higher rate can be justified.
The assumptions used to determine cash flow projections must be reasonable, and based partly on an analysis of the
factors that generated differences between projections of past and current cash flows. In addition, the assumptions used to
determine current cash flow projections must be checked to ensure that they are consistent with actual past results, unless in
the meantime changes have occurred in the investee company’s business model or in the economic environment in which it
operates that justify changes in respect of the past.
Financial assets
Based
on the classification of financial assets required by IAS 39, the
Company classified its financial assets at the time of the
transition to International Accounting Standards, and subsequently when individual financial assets were acquired.
Minority interests and investments in funds, which constitute the main, predominant area of the Parent Company’s operations,
are classified under available-for-sale assets, which are recorded at fair value with a balancing item in shareholders’ equity.
IFRS 13.9 provides a “new” definition of fair value. It represents “the price that would be received to sell an asset or paid to
transfer a liability in an orderly transaction between market participants at the measurement date”.
The concept of fair value is characterised by the following features:
1. it is fundamentally related to the free market and the values reflected therein;
2. it is calculated using the exit price as the relevant price;
3. it relates to the date on which the measurement is made;
4.
it relates to an “orderly” transaction, i.e. it is not a forced
transaction, such as a compulsory administrative liquidation or a
sale at below cost.
Assets and liabilities measured at fair value may be:
• stand-alone assets or liabilities (financial or non-financial instruments);
• a group of assets, a group of liabilities or a group of assets and liabilities.
In the case of assets not listed on active markets, such as the Company’s direct investments in companies and its investments
in venture capital funds, the fair value reported in the Financial Statements is determined by the directors based on their best
estimate and judgement, using the knowledge and evidence available when the Financial Statements are prepared.
In these cases, it is provided that:
• if there are recent transactions related to the same financial instrument, these may be used to determine fair value after
verifying that there have been no significant changes in the economic environment between the date of the transactions
being considered and the valuation date;
•
if there are transactions involving similar financial instruments,
these may be used to determine fair value after verifying the
similarity (as a function of the type of business, size, geographic market, etc.) between the instrument for which transactions
have been found and the instrument to be valued;
• if no prices can be found in active markets, fair value must be determined using valuation models that account for all factors
that market participants would consider in setting a price.
However, due to objective difficulties in making assessments and the absence of a liquid market, the values assigned to such
assets could differ, and in some cases significantly, from those that could be obtained when the assets are sold.
Direct investments in companies that are neither subsidiaries nor associates and in venture capital funds are classified as
available-for-sale
financial assets, which are initially reported at fair value on the
date of the original posting. These assets are
measured at fair value when all interim and full-year Financial Statements are prepared.
DeA Capital - Annual financial statements for the year ending 31 December 2014
159

Gains and losses from fair value measurement are posted to a special shareholders’ equity reserve called the “fair value
reserve” until the investment is sold or otherwise disposed of, or until impairment occurs, in which cases the gain or loss
previously recorded in the fair value reserve is posted to the Income Statement for the period.
At each reporting date, a test is performed as to the existence of objective evidence of impairment following one or more
events that have occurred after the initial recording of the asset, and that this event (or events) has an impact on the
estimated cash flow from the financial asset.
For
equity instruments, a significant or prolonged reduction in fair value
below their cost is considered to be objective evidence
of impairment.
Although International Accounting Standards introduced an important reference to quantitative parameters that must be
adhered to, they do not govern quantitative limits to determine when a loss is significant or prolonged.
Thus, DeA Capital S.p.A. has adopted an accounting policy that defines these parameters. In particular, “significant” means
there has been an objective reduction in value when fair value is more than 35% below its historical cost. In this case,
impairment is recorded in the Income Statement without further analysis.
The duration of the reduction in value is deemed to be prolonged when the reduction of fair value below historical cost
continues for a period of over 24 months. After exceeding 24 months, impairment is recorded in the Income Statement
without further analysis.
Derivatives
Derivatives contracts are recorded in the Statement of Financial Position at fair value. Fair value changes are reported
differently depending on their designation (hedging or speculative) and the nature of the risk hedged (fair value hedge or cash
flow hedge).
For contracts designated for hedging purposes, the Company documents this relationship when the hedge is established.
The documentation incorporates the identification of the hedging instrument, the item or transaction hedged, the nature of
the risk hedged, the criteria used to ascertain the effectiveness of the hedging instrument as well as the risk. The hedge is
considered effective when the projected change in fair value or in the cash flows of the hedged instrument is offset by the
change in fair value or in the cash flows of the hedging instrument, and the net results fall within the range of 80% to 125%.
If the instruments are not, or cannot be, designated as hedging instruments, they must be considered “speculative”; in this
case, fair value changes are posted directly to the Income Statement.
In the case of fair value hedges, changes in the fair value of the hedging instrument and the hedged instrument are posted
to the Income Statement regardless of the valuation criterion used for the hedged instrument. In the case of cash flow
hedges, the portion of the fair value change in the hedging instrument that is recognised as an effective hedge is posted to
shareholders’ equity, while the portion that is not effective is posted to the Income Statement.
Receivables and payables
A receivable is first reported at fair value on the date it is agreed.
After initial reporting, receivables are valued at amortised cost. Payables that fall due within normal contractual terms are
initially posted at fair value and later valued at amortised cost.
Cash and cash equivalents
Cash and cash equivalents include cash at hand, demand deposits and short-term, highly liquid financial investments that are
readily convertible to cash and subject to a negligible risk of price variation. Their value is reported at fair value.
Held-for-sale assets
A
non-current asset or disposal group is classified as held for sale if
the carrying value will mainly be recovered from its sale or
disposal
instead of its ongoing use. In order for this to occur, the asset or
disposal group must be available for immediate sale
in
its current condition, and the sale must be highly likely. Assets
meeting the criteria to be classified as held-for-sale assets
are valued at the lower of carrying value and sales value adjusted for any related costs.
160 DeA Capital - Notes to the financial statements

Treasury shares
Treasury shares are not considered financial assets of the company that issued the shares. The purchase and sales value of
treasury shares is recorded as a change to shareholders’ equity. No gain or loss is reported in the Income Statement for the
sale, purchase, issue or cancellation of treasury shares.
Fair value reserve
The fair value reserve incorporates fair value changes to entries measured at fair value with a balancing entry in shareholders’
equity.
Warrants
Warrants issued by the Company, which do not meet the requirements either for being classified as share-based payments to
employees pursuant to IFRS 2 or as financial liabilities, are treated as company equity instruments.
Provisions for risks and charges
If necessary, the Company records provisions for risks and future provisions when:
• it has a legal or implicit obligation to third parties resulting from a past event;
• it is likely that it will be necessary to use company resources to fulfil the obligation;
• a reliable estimate can be made of the amount of the obligation.
Provisions are recorded based on the projected value and discounted as necessary to present value if the time value is
considerable. Changes in estimates are recognised in the Income Statement of the period in which the change occurs.
Revenues and income
Service revenues are recognised at the time the services are rendered based on the progress of the activity on the reporting
date.
Income from equity investments for dividends or for their full or partial sale is reported when the right to receive payment
is determined, with a balancing item (receivable) at the time of the sale or decision to distribute dividends by the entity or
appropriate body.
Interest is reported using the effective interest rate method.
Employee benefits
Short-term employee benefits, whether in cash or in kind (meal vouchers) are reported in the income statement in the period
when the work is performed.
Employee benefits related to participation in a defined benefit plan are determined by an independent actuary using the
projected unit credit method.
On 16 June 2011, the IASB published a revised version of IAS 19 “Employee Benefits”. Among other things, this document
modified the accounting rules of defined benefit plans (“Post-employment benefits: defined benefit plans”) and termination
benefits.
Specifically:
• For “Post-employment benefits: defined benefit plans”, the option to use the “corridor approach” to account for actuarial
gains and losses was eliminated. These must now be recognised in the Statement of Performance. The resulting
remeasurement effect cannot be recycled through P&L but should be accumulated asa separate account within equity. No
other option is available;
Actuarial gains and losses include profits and losses of a technical nature due to changes in the actuarial assumptions
adopted and/or the fact that experience may differ from the actuarial assumptions adopted (e.g. staff turnover, early
retirement, mortality, change in the discount rate);
• past service costs and the effects generated by curtailments and/or plan settlement (caused, for example, by a significant
reduction in the number of employees covered by the plan, changes to the plan’s terms and conditions) are recorded
immediately in the income statement under Personnel costs;
DeA Capital - Annual financial statements for the year ending 31 December 2014
161

• The interest cost (resulting from the discounting to present value process) and the expected returns on assets servicing
the plan are replaced by a net interest figure reported in the income statement under financial charges and calculated
by applying a discount rate (based on the high-quality corporate bonds rate at the end of the year) to the balance of the
existing plan at the beginning of the year.
Employee benefits in respect of participation in a defined contribution plan only relate to those plans under mandatory
government administration. The payment of contributions fulfils the company’s obligation to its employees. Thus, contributions
are costs in the period in which they are due.
Benefits have been provided in the form of stock options and share-based payments. This applies to all employees eligible
for stock option plans. The cost of these transactions is determined with reference to the fair value of the options on the date
allocation is made and is reported over the period from such date until the expiry date with a balancing entry in shareholders’
equity.
The cost of stock options for the company’s directors and employees is determined in the same way.
Income tax
Current income taxes are determined and reported on the basis of a reasonable forecast of tax liability by applying the tax
rates in force to taxable income, taking into account any exemptions and tax credits to which the company may be entitled.
Deferred
tax liabilities are allocated for all temporary differences between the
carrying value of the assets and liabilities and
the corresponding amount for tax purposes.
Deferred tax assets are recorded for all deductible temporary differences and for tax assets and liabilities carried forward to
the
extent that it is likely there will be sufficient future taxable profit
against which the deductible temporary differences and
the tax assets and liabilities carried forward can be used.
Deferred taxes are classified under non-current assets and liabilities and are determined using tax rates expected to be
applicable in the years when the temporary differences will be realised or will expire.
The
carrying values of deferred tax assets are analysed periodically and
reduced if it is not likely that sufficient taxable income
will be generated against which the benefits resulting from such deferred assets can be used.
Earnings per share
In accordance with IAS 33, basic earnings per share is determined as the ratio of net profit for the period attributable to
holders of parent company shares to the weighted average number of shares outstanding during the period. Treasury shares in
the portfolio are, of course, not included in this calculation.
Diluted earnings per share is calculated by adjusting the weighted average number of shares outstanding for all potential
ordinary
shares resulting from the potential exercise of assigned stock options,
which may therefore result in a diluting effect.
C. Changes in accounting principles and the treatment of errors
Accounting principles are changed from one year to another only if the change is dictated by an accounting standard or if it
contributes to providing more reliable information or more complete reporting of the impact of transactions on the company’s
balance sheet, income statement and cash flow.
Changes in accounting principles are applied retrospectively with the impact reflected in shareholders’ equity in the first of
the periods presented. Comparative reporting is adapted accordingly. The prospective approach is used only when it is not
practical to restate comparative reporting. The application of a new or amended accounting standard is recorded as required
by the standard itself. If the standard does not specify transition methods, the change is reflected retrospectively, or if
impractical, prospectively.
If there are significant errors, the same treatment dictated for changes in accounting principles is used. If there are minor
errors, corrections are posted to the income statement in the period when the error is discovered.
162 DeA Capital - Notes to the financial statements

D. Use of estimates and assumptions in preparing the financial statements
The Company’s management must make assessments, estimates and assumptions that affect the application of accounting
standards and the amounts of assets, liabilities, costs and revenues recorded in the financial statements. Estimates and
related assumptions are based on past experience and other factors deemed reasonable in the case concerned; these have
been used to estimate the carrying value of assets and liabilities that cannot be easily obtained from other sources.
These estimates and assumptions are reviewed regularly. Any changes resulting from revisions to accounting estimates are
recorded in the period when the revision is made if such revisions only affect that period. If the revision affects current and
future periods, the change is recorded in the period in which the revision is made and in related future periods.
Financial statement balances are reported and valued using the valuation criteria described above. At times, the application
of these criteria involves the use of estimates that may have a significant impact on amounts reported in the financial
statements. Estimates and related assumptions are based on past experience and factors deemed reasonable in the case
concerned; these are used to estimate the carrying value of assets and liabilities that cannot be easily obtained from other
sources. However, since these are estimates, the results obtained should not necessarily be considered definitive.
With the understanding that the use of reasonable estimates is an essential part of preparing financial statements, the items
where the use of estimates is most prevalent are stated below:
• valuation of financial assets not listed in active markets;
• valuation of financial assets listed in active markets but considered illiquid on the reference market;
• valuation of equity investments.
The process described above is made particularly complicated by the unusual levels of volatility in the current macroeconomic
and market environment, which affect financial indicators that have a bearing on the above valuations.
An estimate may be adjusted as a result of changes in the circumstances on which it was based, or as a result of new
information. Any change in the estimate is applied prospectively and has an impact on the income statement in the period in
which the change occurred and potentially on income statements in future periods.
As highlighted earlier, a significant proportion of the assets shown in the annual financial statements of DeA Capital S.p.A. is
represented by unlisted financial investments. These investments are valued at their fair value, calculated by directors based
on their best estimate and judgement using the knowledge and evidence available at the time the financial statements are
prepared. However, due to objective difficulties in making assessments and the lack of a liquid market, the values assigned to
such investments could differ, and in some cases significantly, from those that could be obtained when the assets are sold.
DeA Capital - Annual financial statements for the year ending 31 December 2014
163
Notes to the balance sheet
NON-CURRENT ASSETS
1 - Intangible and tangible assets
1a - Intangible assets
Changes in intangible assets are shown in the tables below:
Cum.
Cum.amort.
Net
amort.
Net
Historical
& write-
carrying
Historical
& write-
carrying
cost at
downs at
value at
cost at
downs at
value at
(EUR thousand)
1.1.2014
1.1.2013
1.1.2014
31.12.2014
31.12.2014
31.12.2014
Concessions, licences and trademarks
313
(306)
7
330
(316)
14
Total
313
(306)
7
330
(316)
14
Balance at
Disposals
Balance at
(EUR thousand)
1.1.2014
Acquisitions Disposals
(provision)
Amort.
31.12.2014
Concessions, licences and trademarks
7
17
0
0
(10)
14
Total
7
17
0
0
(10)
14
The increase in “Concessions, licences and trademarks” relates to the acquisition of new software licences, the cost of which
will be amortised over three years.
1b - Tangible assets
Changes in tangible assets are shown in the tables below:
Cum. depr.
Net
Cum. depr.
Net
Historical
& write-
carrying
Historical
& write-
carrying
cost at
downs at
value at
cost at
downs at
value at
(EUR thousand)
1.1.2014
1.1.2014
1.1.2014
31.12.2014
31.12.2014
31.12.2014
Plant
86
(86)
0
7
(6)
1
Furniture and fixtures
483
(353)
130
418
(309)
109
Computer and office equipment
178
(170)
8
59
(53)
6
Leasehold improvements
752
(113)
639
663
(212)
451
Non-depreciable tangible assets
28
0
28
20
0
20
Total
1,527
(722)
805
1,167
(580)
587
Balance at
Disposals
Disposals
Balance at
(EUR thousand)
1.1.2014
Acquisitions
(at cost)
(provision)
Depr.
31.12.2014
Plant
0
1
(80)
80
0
1
Furniture and fixtures
130
19
(84)
84
(40)
109
Computer and office equipment
8
4
(123)
122
(5)
6
Leasehold improvements
639
0
(89)
0
(99)
451
Non-depreciable tangible assets
28
0
(8)
0
0
20
Total
805
24
(384)
286
(144)
587
Depreciation is calculated on a straight-line basis, according to the estimated useful life of the asset.
The depreciation rates used in the financial year were: 20% for specific plant assets, 12% for furniture and furnishings, 20%
for electronic office machines and 15% for leasehold improvements.
164 DeA Capital - Notes to the financial statements
2 - Financial investments
2a - Investments in subsidiaries
Investments in subsidiaries are measured at fair value in accordance with IAS 39 and IFRS 13.
Details of the existing investments at 31 December 2014 are shown in the table below:
%
%
shareholding
Value at
shareholding
Value at
(EUR thousand)
at 31.12.2014
31.12.2014
at 31.12.2013
31.12.2013
DeA Capital Investments S.A.
0.00%
0
100.00%
385,202
DeA Capital Real Estate S.p.A.
100.00%
145,080
100.00%
89,300
I.F.IM. S.r.l.
0.00%
0
100.00%
60,430
IDeA Opportunity Fund I
46.99%
55,971
0.18%
0
IDeA FIMIT SGR S.p.A.
3.00%
5,939
3.00%
5,835
IDeA Capital Funds SGR S.p.A.
100.00%
49,910
100.00%
51,813
Total
256,900
592,580
DeA Capital Investments S.A.
On 14 November 2014, the Luxembourg company DeA Capital Investments S.A., a wholly-owned subsidiary, was merged
into the Company. The adjustment of the equity investment to merger value resulted in a write-down of EUR 190,246
thousand.
The above merger will make it possible to optimise the organisational structure.
DeA Capital Real Estate S.p.A./ I.F.IM. S.r.l.
On 14 November 2014, DeA Capital Real Estate S.p.A. completed the merger by incorporation of the wholly-owned subsidiary
I.F.IM. S.r.l., with a resulting increase of EUR 60,430 thousand in the equity investment in DeA Capital S.p.A.
The fair value measurement of the equity investment at 31 December 2014, which was based on the documents received and
the information available, resulted in a decrease in fair value of EUR 4,650 thousand.
IDeA Opportunity Fund I (IDeA OF I)
On 10 March 2014, the Company received an in-kind distribution of fund units from the Luxembourg company DeA Capital
Investments S.A.
The units in IDeA OF I are valued at around EUR 55,971 thousand in the financial statements to 31 December 2014. The
change in the carrying value compared with 31 December 2013 was due to an in-kind distribution of approximately EUR
56,359 thousand, contributions made for capital calls totalling EUR +2,399 thousand, thousand, capital reimbursements of
EUR - 5,077 thousand and a net increase in fair value of around EUR +1,311 thousand.
IDeA FIMIT SGR S.p.A.
The fair value measurement of the equity investment at 31 December 2014, which was based on the documents received and
the information available, required the investee company to be revalued by EUR 104 thousand.
IDeA Capital Funds SGR S.p.A.
The fair value measurement of the equity investment at 31 December 2014, which was based on the documents received and
the information available, made it necessary to record impairment of EUR 1,903 thousand for the investee company.
Due to the above, the changes in the item under review at 31 December 2014 compared with end-2013 relate to:
• a decrease of EUR 385,202 thousand, due to the merger of DeA Capital Investments S.A. into the Company;
•
a decrease of EUR 60,430 thousand, due to the merger of I.F.IM. S.r.l.
into DeA Real Estate S.p.A., and a resulting increase of
EUR 60,430 thousand in the equity investment in DeA Real Estate S.p.A.;
• an increase of EUR 56,359 thousand due to the in-kind distribution of IDeA OF I made by DeA Capital Investments S.A. in the
year, and reclassification of the entire investment in the item in question;
• the measurement at fair value of the subsidiaries, which entailed decreases of EUR 190,246 thousand for DeA Capital
DeA Capital - Annual financial statements for the year ending 31 December 2014
165
Investments S.A., EUR 4,650 thousand for DeA Capital Real Estate S.p.A., and EUR 1,903 thousand for IDeA Capital Funds SGR
S.p.A., and increases of EUR 104 thousand for IDeA Fimit SGR S.p.A. and EUR 1,311 thousand for IDeA Opportunity Fund I.
A list of the equity investments with the information required under art. 2427 of the Italian Civil Code is shown in the table
below:
Consolidated
Consolidated
net profit/
Share of
Company
Registered Currency
Share shareholders’
(loss) for
%
shareholders’
Carrying
office
capital
equity
the year holding equity (EUR)
value (EUR)
DeA Capital Real
Estate S.p.A.
Milan, Italy
Eur
600,000
60,866,649
5,341,615
100,00%
60,866,649
145,080,270
IDeA Opportunity
Fund I
Milan, Italy
Eur
158,861,080
119,119,677
7,890,790
46,99%
55,970,571
55,970,571
IDeA FIMIT
SGR S.p.A.
Rome, Italy
Eur
16,757,557
219,670,671
4,386,570
3,00%
6,590,120
5,938,800
IDeA Capital
Funds SGR S.p.A.
Milan, Italy
Eur
1,200,000
5,803,944
3,605,179
100,00%
5,803,944
49,910,370
Total
21,224,154
129,231,284
256,900,011
2b - Investments in associated companies and funds
At 31 December 2014, this item totalled EUR 14,221 thousand, as shown in the following table.
Balance
Dea Capital
Impairment
at Distribution
Inv. S.A.
Capital
Fair value
on income
Balance at
(EUR thousand)
1.1.2014
S.A.
merger increases adjustment statement
31.12.2014
Sigla Luxembourg S.A.
0
0
12,085
0
(884)
0
11,201
Atlantic Value Added
0
2,560
0
750
(290)
0
3,020
Total
0
2,560
12,085
750
-1,174
0
14,221
LThe changes in the item under review at 31 December 2014 compared with end-2013 relate to:
• an increase of EUR 2,560 in the units of Atlantic Value Added due to the in-kind distribution made by DeA Capital
Investments S.A. on 10 March 2014;
• an increase of EUR 12,085 thousand in the equity investment in Sigla Luxembourg S.A. resulting from the merger of DeA
Capital Investments S.A. on 14 November 2014;
• the fair value measurement of associated companies resulting in decreases of EUR 884 thousand for Sigla Luxembourg S.A.
and EUR 290 thousand for Atlantic Value Added.
2c - Investments in other companies
This
item, which totalled EUR 209,320 thousand at 31 December 2014, includes
three direct minority interests in foreign companies,
the investment in Harvip Investimenti S.p.A. and the investment in Kenan Investments S.A., as shown in the following table.
Impairment
Balance at Dea Capital Inv.
Fair value
on income
Balance at
(EUR thousand)
1.1.2014
S.A. merger
adjustment
statement
31.12.2014
Kenan Investments S.A.
0
186,235
22,901
0
209,136
Harvip Investimenti S.p.A.
184
0
0
0
184
Total
184
186,235
22,901
0
209,320
166 DeA Capital - Notes to the financial statements
Changes in this item at 31 December 2014 compared with end-2013 were for the EUR 186,235 thousand increase in the
investment in Kenan Investments S.A. resulting from the merger of DeA Capital Investments S.A. on 14 November 2014,
and the increase in fair value of this equity investment (EUR 22,901 thousand).
2d - Available-for-sale funds
This item relates to investments in seven venture capital funds totalling EUR 9,580 thousand, compared with EUR 10,682
thousand at the end of 2013, and five closed-end mutual investment funds in an amount of EUR 134,804 thousand compared
with EUR 122,464 thousand at end-2013, as shown in the table below:
Impairment
Decreases
and related
Balance at
Increases
(capital
exchange
Fair value
Translation
Balance at
(EUR thousand)
1.1.2014
Restatements
(capital call) distribution)
effect
adjustment
effect
31.12.2014
Total venture
capital funds
10,682
0
0
(193)
(323)
(1,424)
838
9,580
Closed-end mutual
investment funds
122,464
(978)
14,959
(24,331)
(933)
23,623
0
134,804
Total funds
133,146
(978)
14,959
(24,524)
(1,256)
22,199
838
144,384
Over 2014, the Company received income distributions of EUR 298 thousand and capital reimbursements of EUR 24,524
thousand.
The fair value measurement of investments in venture capital funds at 31 December 2014, carried out based on the
information and documents received from the funds, as well as other available information, meant that the amount had to be
written down, along with the related exchange rate effect, by EUR 323 thousand; the significant reduction to below cost was
considered clear evidence of impairment.
The other changes related to the decrease in fair value (and associated exchange rate effect) of EUR 586 thousand.
The units in closed-end mutual investment funds relate to:
• The units in IDeA I FoF are valued at around EUR 93,476 thousand in the financial statements to 31 December 2014. The
change in the carrying value compared with 31 December 2013 was due to contributions made for capital calls totalling EUR
3,518 thousand, capital reimbursements of EUR 21,424 thousand and a net increase in fair value of around EUR 16,677
thousand;
• The units in IDeA ICF II are valued at around EUR 35,254 thousand in the financial statements to 31 December 2014. The
change in the carrying value compared with 31 December 2013 was due to contributions made for capital calls totalling
EUR 7,304 thousand, capital reimbursements of EUR 2,907 thousand and a net increase in fair value of around EUR 7,069
thousand;
• The units in IDeA EESS are valued at around EUR 4,330 thousand in the financial statements to 31 December 2014. The
change compared with 31 December 2013 was due to contributions made for capital calls totalling EUR 2,269 thousand and
a write-down of around EUR 933 thousand due to a permanent loss in value;
• On 9 April 2014, units totalling EUR 1,777 thousand were subscribed in the new fund IDeA ICF III. At end-2014, the value
was EUR 1,740 thousand due to the decrease in fair value of about EUR 37 thousand;
• Lastly, on 29 December 2014, units were subscribed in the new fund IDeA ToI totalling EUR 91 thousand. At end-2014, the
value was EUR 4 thousand due to the decrease in fair value of about EUR 87 thousand.
DeA Capital - Annual financial statements for the year ending 31 December 2014
167
3 - Other non-current assets
3a - Deferred tax assets
Deferred tax assets of EUR 8,402 thousand were fully offset against deferred tax liabilities.
The changes in deferred tax assets and deferred tax liabilities are shown in the table below:
Recognised
Balance at
in income
Recognised
Balance at
(EUR thousand)
1.1.2014
statement
in equity
31.12.2014
Total deferred tax assets
0
0
0
0
Deferred tax liabilities for:
- available-for-sale financial assets
(1,644)
0
(6,758)
(8,402)
Total deferred tax liabilities
(1,644)
0
(6,758)
(8,402)
Losses carried forward available for offset
against future taxable profits
1,644
6,758
0
8,402
Total deferred tax assets,
net of deferred tax liabilities
0
6,758
(6,758)
0
No deferred tax assets were allocated against the significant tax losses of DeA Capital S.p.A. of around EUR 108,074 thousand,
which are fully usable, and about EUR 879 thousand, which are usable on a limited basis; the entire amount cannot be
transferred to the tax consolidation scheme. This was because there was insufficient information for the group to believe that
taxable income would be generated in future periods against which such tax losses could be recovered.
Deferred taxes were calculated using the liability method based on the temporary differences at the reporting date between the
tax amounts used as a reference for the assets and liabilities and the amounts reported in the financial statements.
3b - Tax receivables relating to the tax consolidation scheme entered into by the parent
companies
This item, totalling EUR 546 thousand at 31 December 2014, relates to the receivable from the Parent Company De Agostini
S.p.A. (previously B&D Holding di Marco Drago e C. S.a.p.A.) for participation in the tax consolidation scheme.
4 - Current assets
At 31 December 2014, current assets were approximately EUR 43,955 thousand compared with EUR 51,940 thousand at 31
December 2013.
4a - Trade receivables
This item totalled EUR 557 thousand (EUR 647 thousand at 31 December 2013) and relates to:
- EUR 147 thousand from De Agostini S.p.A. for the agreement to sublet rented premises and the reimbursement of costs
associated with said agreement, and the pro rata reimbursement for improvements to leased assets incurred for the building
at Via Brera, 21;
- EUR 44 thousand from DeA Innovation Real Estate S.p.A. (IRE), EUR 223 thousand from IDeA FIMIT SGR S.p.A, EUR 99
thousand from IDeA Capital Funds SGR S.p.A., EUR 5 thousand from De Agostini Publishing Italia S.p.A., EUR 39 thousand from
Gtech S.p.A. for the pro rata reimbursement for improvements to leased assets incurred for the building at Via Brera, 21.
These receivables break down by region as follows:
- 65.80% from Italian subsidiaries;
- 26.40% from Italian parent companies;
- 7.80% from Italian affiliates.
168 DeA Capital - Notes to the financial statements

4b - Financial receivables
This item totalled EUR 1,710 thousand at 31 December 2014 and relates to:
• EUR 1,699 thousand disbursed under a 12-month revolving credit line of up to EUR 5 million in favour of Sigla S.r.l., a
wholly-owned subsidiary of associate company Sigla Luxembourg S.A., which focuses on the sale of salary-backed loans; the
line is secured by a lien on 51% of the financed company’s shares and signed on 26 September 2014;
•
EUR 11 thousand for interest accrued but not yet paid on this revolving
credit line (variable rate of 1-month Euribor + spread).
At 31 December 2013, the item amounted to EUR 42,549 thousand and relates to a revolving credit line with the subsidiary
DeA Capital Investments S.A., which was repaid before the merger by incorporation.
4c - Tax receivables from parent companies relating to the tax consolidation scheme
This item, totalling EUR 2,783 thousand (EUR 3,107 thousand at 31 December 2013) relates to the receivable from the Parent
Company De Agostini S.p.A. (previously B&D Holding di Marco Drago e C. S.a.p.A.) for participation in the tax consolidation
scheme.
4d - VAT receivables from parent companies
This item, totalling EUR 115 thousand, relates to the receivable in December 2014 from the Parent Company De Agostini
S.p.A. (previously B&D Holding di Marco Drago e C. S.a.p.A.) for its part in settling Group VAT.
4e - Other tax receivables
This item, totalling EUR 289 thousand (EUR 778 thousand at 31 December 2013), relates to:
- tax deductions in the form of advance payments on interest of EUR 5 thousand;
- a receivable arising from an application for an IRES refund due to non-deduction of IRAP relating to personnel costs for
2010/2011, of EUR 93 thousand;
- advance payments made in relation to foreign direct and indirect taxes in Luxembourg for EUR 191 thousand.
4f - Other receivables
These receivables, totalling EUR 539 thousand (EUR 524 thousand at 31 December 2013), relate mainly to prepaid expenses,
receivables for guarantee deposits and advances to suppliers.
These receivables fall due within the next year.
4g - Cash and cash equivalents
Cash and cash equivalents consist of bank deposits and cash (EUR 4 thousand), including interest accrued at 31 December
2014. This item totalled EUR 37,962 thousand at end-2014 compared with EUR 3,776 thousand at end-2013.
This increase is primarily due to the combined effect of the following factors:
- receipt of dividends of EUR 5,322 thousand from DeA Capital Real Estate S.p.A. and of EUR 120,000 thousand from DeA
Capital Investments S.A., EUR 1,900 thousand from I.F.IM. S.r.l., EUR 271 thousand from IDeA FIMIT SGR S.p.A., EUR
4,000 thousand from IDeA Capital Funds SGR S.p.A., and EUR 64 thousand from Soprarno SGR S.p.A.;
- repayment of EUR 120,000 from the credit line with Mediobanca;
- repayment of EUR 27,000 thousand from the credit line taken out with Intesa SanPaolo S.p.A.;
- receipt of EUR 11,791 thousand for distributions received from available-for-sale funds excluding capital calls paid;
- receipt of EUR 3,689 thousand in remuneration for losses transferred to Parent Company De Agostini S.p.A. (previously
B&D Holding di Marco Drago e C. S.a.p.A.) for participation in the tax consolidation scheme;
- receipt of EUR 1,220 thousand from the sale of the shareholding in Soprarno SGR S.p.A.;
- bank interest and commission of EUR -3,073 thousand in relation to the credit lines taken out with Mediobanca and
Intesa SanPaolo S.p.A.;
- service expenses net of reimbursements to subsidiaries and associates of EUR 7,469 thousand;
- the purchase of treasury shares in the amount of EUR 3,720 thousand;
- outlay of EUR 95,152 thousand for the credit line received from the subsidiary DeA Capital Investments S.A.;
- outlay of EUR 138,412 thousand for the credit line granted to the subsidiary DeA Capital Investments S.A.
Please see the Company’s Cash Flow Statement for further information on changes to this item.
DeA Capital - Annual financial statements for the year ending 31 December 2014
169

5 - Held-for-sale assets
This item is zero at 31 December 2014 (was 1,285 thousand Euro at 31 December 2013) following the sale of the shareholding
in Soprarno SGR S.p.A. on 9 May 2014.
6 - Shareholders’ equity
At 31 December 2014, shareholders’ equity totalled approximately EUR 655,217 thousand, compared with EUR 630,050
thousand at 31 December 2013.
The increase of around EUR 25,167 thousand in shareholders’ equity in 2014 was mainly due to:
- an increase of EUR 33,365 thousand in the fair value reserve;
- the purchase of treasury shares in the amount of EUR 3,720 thousand;
- the loss of EUR 4,519 thousand for the period.
Please see the Statement of Changes in Shareholders’ Equity for more information on the main changes in this item.
6a - Share capital
The share capital (fully subscribed and paid up) totalled EUR 306,612,100, represented by 306,612,100 shares (of which
34,985,736 treasury shares) with a nominal value of EUR 1 each.
Given that the nominal value of the 34,985,736 treasury shares held at 31 December 2014 is deducted from total share
capital, share capital of EUR 271,626,364 was reported in the Financial Statements.
Changes in share capital are shown in the table below:
31.12.2014
31.12.2013
(EUR thousand)
No. of shares
amount No. of shares
amount
Share capital
306,612,100
306,612
306,612,100
306,612
of which: Own shares
(34,985,736)
(34,986)
(32,637,004)
(32,637)
Share capital (excluding own shares)
271,626,364
271,626
273,975,096
273,975
The table below shows a reconciliation of the shares outstanding:
Shares
Own shares
Shares
(EUR thousand)
issued
in portfolio
in issue
Shares at 31 December 2013
306,612,100
(32,637,004)
273,975,096
Changes in 2014
Share capital increase
0
0
0
Own shares purchased
0
(2,348,732)
(2,348,732)
Own shares sold
0
0
0
Own shares disposed of
0
0
0
Used for stock option plan
0
0
0
Shares issued for stock options
0
0
0
Shares at 31 December 2014
306,612,100
(34,985,736)
271,626,364
170 DeA Capital - Notes to the financial statements
6b - Share premium reserve (net of share issue costs reserve)
This item decreased by EUR 1,371 thousand (from EUR 386,198 thousand at 31 December 2013 to EUR 384,827 thousand
at 31 December 2014) after the posting of the purchase of treasury shares to this reserve
6c - Legal reserve
This reserve totalled EUR 61,322 thousand, which was unchanged from the figure at 31 December 2013.
6d - Fair value reserve
The fair value reserve is positive at EUR 12,908 thousand (compared with a negative balance of EUR 20,457 thousand at
31 December 2013) and comprises:
- the reserve for first-time adoption of IAS/IFRS, which has a negative balance of EUR 3,745 thousand (unchanged from
31 December 2013);
- a positive fair value reserve of EUR 16,653 thousand compared with a negative value of 16,712 thousand at
31 December 2013.
The table below shows a summary of the changes in this item during the year:
Use of
fair value
Balance at
reserve for
Fair value
Tax
Balance at
(EUR thousand)
1.1.2014
Restatements impairment
adjustment
effect
31.12.2014
Direct investments/equity
investments
(21,052)
55
0
17,086
(389)
(4,300)
Venture capital
1,990
0
0
(587)
173
1,576
Closed-end mutual
investment funds
2,350
(55)
0
23,649
(6,567)
19,377
Reserve for IFRS first-time
adoption to other reserves
(3,745)
0
0
0
0
(3,745)
Total
(20,457)
0
0
40,148
(6,783)
12,908
6e - Other reserves
Other reserves, totalling EUR 504 thousand, comprise:
- a reserve for stock option costs totalling EUR 1,034 thousand;
- a reserve for the merger of the subsidiary IDeA AI totalling EUR -831 thousand;
- a reserve for actuarial gains/losses on the end-of-service payment fund of EUR -112 thousand;
- a reserve for the sale of option rights, unchanged from 31 December 2013, totalling EUR +413 thousand. This originated
from the sale of the remaining option rights to subscribe to a capital increase that had not been exercised by the
shareholders, and were sold by the Company.
6f - Retained earnings (losses) carried forward
This item totalled EUR -71,451 thousand and includes profit carried forward from previous periods.
DeA Capital - Annual financial statements for the year ending 31 December 2014
171
6g - Profit/(loss) for the year
This item includes a loss of EUR 4,519 thousand for the year 2014, compared with a loss of EUR 62,866 for the year 2013.
Art. 2427, para. 1, 7-bis of the Italian Civil Code: details of shareholders’ equity items
The table below shows a breakdown of shareholders’ equity at 31 December 2014, with details of their origin, how they can be
used and paid out, and use in previous years:
Summary of use in the
three previous years
Description
Potential
Amount
to cover
for other
(in EUR)
Amount
use
available
losses
reasons
Share capital
271,626,364
=
=
Share capital reserve:
Share premium reserve
392,655,096
A,B,C
392,655,096
=
=
Profit reserves:
Legal reserve
61,322,420
B
=
=
=
Reserve for costs relating to share
issue
(7,828,172)
=
=
=
=
Stock option reserve
1,034,305
=
=
=
=
Reserve for sale of option rights
412,798
=
=
=
=
Merger reserve
(831,486)
=
=
=
=
Fair value reserves
12,908,007
=
=
=
=
Reserve for actuarial gains / losses
(111,491)
=
=
=
=
Earnings (losses) carried forward
(71,451,400)
A,B,C
=
=
=
Profit (loss) for the year
(4,519,219)
=
=
=
=
TOTAL
(655,217,222)
392,655,096
Key: A = capital increase, B = to cover loss, C = distribution to shareholders
7 - Non-current liabilities
7a - End-of-service payment fund
The end-of-service payment fund is a defined benefit plan, and has therefore been valued using actuarial assessments. The
assumptions used in calculating the fund were: a discount rate of 1.50%; an annual rate of inflation of 1.75%; annual salary
growth of 2.75%; and an annual fund growth rate of 2.81%.
Changes in the end-of-service payment fund were as follows:
Balance at
Portion
Balance at
(EUR thousand)
1.1.2014
accrued
Payments
Advances
31.12.2014
Change in end-of-service
payment fund
384
175
0
0
559
The amounts concerned were calculated as follows:
(EUR thousand)
31.12.2014
31.12.2013
Nominal value of end-of-service payment fund
468
348
Discounting effect
91
36
Current value of end-of-service payment fund
559
384
172 DeA Capital - Notes to the financial statements

7b - Financial liabilities
This item was reduced to zero at 31 December 2014 (EUR 122,206 thousand at 31 December 2013) following:
- the cancellation of the payable to the seller of FARE Holding (now DeA Capital Real Estate) of EUR 2,206 thousand, inclusive
of interest calculated at present value accrued from the closing date (12 December 2008) to 30 June 2014, of EUR 50
thousand;
- the full repayment of the existing credit line with Mediobanca - Banca di Credito Finanziario S.p.A. (EUR 120 million), with
the resulting elimination of the bullet loan (EUR 80 million), and simultaneous restoration of its availability up to a maximum
of EUR 40 million, extended for one year, and hence until 16 December 2016.
7c - Other payables
This item totalled EUR 11,407 thousand (EUR 1 thousand at 31 December 2013) and mainly relates to the allocation of carried
interest to be paid to the lead investor BC Partners as a result of the total capital gain on the investment in Kenan.
8 - Current liabilities
Total current liabilities amounted to EUR 14,150 thousand (EUR 30,292 thousand at 31 December 2013) and are all due within
the following year. These payables are not secured on any company assets.
These liabilities are made up of the items detailed below:
8a - Trade payables
This item totalled EUR 1,325 thousand, compared with EUR 1,860 thousand in the previous year, and stems from ordinary
operations.
With regard to transactions with related parties, this item includes:
- payables to affiliate De Agostini Editore S.p.A. of approximately EUR 42 thousand;
- payables to affiliate De Agostini Invest S.A. of approximately EUR 25 thousand;
- payables to affiliate De Agostini Libri S.p.A. of approximately EUR 2 thousand;
- payables to the subsidiary IDeA FIMIT SGR S.p.A. of approximately EUR 33 thousand;
- payables to the parent company IRE S.p.A. of approximately EUR 17 thousand.
A breakdown of these payables by region is set out below:
- 89.84% due to suppliers in Italy;
- 5.23% due to suppliers in respect of affiliates in Italy;
- 3.85% due to suppliers in respect of subsidiaries in Italy;
- 1.04% due to suppliers in Luxembourg;
- 0.04% due to suppliers in the UK.
Trade payables do not accrue interest and are settled, on average, within 30 to 60 days.
8b - Payables to staff and social security organisations
This item amounted to EUR 829 thousand (EUR 859 thousand at 31 December 2013) and breaks down as follows:
- EUR 247 thousand for payables to social security organisations, paid after the end of financial year 2014;
- EUR 582 thousand for payables to staff for holidays not taken, and accrued bonuses.
DeA Capital - Annual financial statements for the year ending 31 December 2014
173

8c - Tax payables to subsidiaries
This item, which amounts to EUR 64 thousand (unchanged on 31 December 2013), relates to the payable to subsidiary
IDeA Capital Funds SGR S.p.A. regarding the application for an IRES refund due to the non-deduction of IRAP in respect of
personnel costs for 2010/2011..
8d - VAT payables to parent companies
This item consists of a payable of EUR 340 thousand generated through the application of the percentage of 64% against
which VAT on purchases made during the year may be offset. The amount is due to Parent Company De Agostini S.p.A.
(previously B&D Holding di Marco Drago e C. S.a.p.A.) for its part in settling Group VAT.
8e - Other tax payables
This item amounted to EUR 184 thousand (EUR 185 thousand at 31 December 2013) and consists of payables to the tax
authorities in respect of taxes deducted from the income of employees and self-employed staff.
8f - Other payables
This item amounted to EUR 11 thousand (EUR 1 thousand at 31 December 2013) and consists of various payables for municipal
taxes.
8g - Short-term financial payables
Financial payables were eliminated (EUR 27,323 thousand at 31 December 2013) due to the repayment of the Intesa SanPaolo
S.p.A. credit line in October 2014.
174 DeA Capital - Notes to the financial statements
Notes to the Income Statement
9 - Revenues and income
9a - Investment income and expenses
Net expenses arising from investments totalled EUR 3,641 thousand in 2014 (compared with EUR 60,979 thousand in 2013).
Details of this item are shown below:
Financial year
Financial year
(EUR thousand)
2014
2013
Dividends from subsidiaries and other income
190,477
134,468
Income from available-for-sale funds
298
278
Capital gains on disposals
0
95
Investment income
190,775
134,841
Impairment IDeA Consulenza S.r.l. (previously IDeA SIM S.p.A.)
0
201
Impairment Soprarno SGR S.p.A.
0
312
Impairment IDeA Capital Fund SGR S.p.A.
1,903
9,586
Impairment IDeA FIMIT SGR S.p.A.
0
115
Impairment I.F.IM. S.r.l.
0
16,782
Impairment DeA Capital Investments S.A.
190,246
167,288
Impairment Sigla Luxembourg S.A.
884
0
Impairment Alkimis SGR S.p.A.
0
188
Impairment Harvip S.p.A.
0
816
Impairment venture capital funds
385
76
Impairment closed-end mutual investment funds
933
456
Capital losses on Soprarno SGR S.p.A. disposal
65
0
Investment charges
194,416
195,820
Total
(3,641)
(60,979)
Dividends from associates and other income
On 10 march 2014, DeA Capital Investments S.A. made an in-kind distribution of the fund units of IDeA Opportunity Fund I and
Atlantic Value Added held by it for a total amount of EUR 58,919 thousand. Subsequently, on 13 November 2014, it made a
second distribution totalling EUR 120,000 thousand.
The item also comprises dividends paid out by:
- IDeA Capital Funds SGR S.p.A., in the amount of EUR 4,000 thousand;
- DeA Capital Real Estate S.p.A., in the amount of EUR 5,322 thousand;
- I.F.IM. S.r.l., in the amount of EUR 1,900 thousand;
- IDeA FIMIT SGR S.p.A., in the amount of EUR 272 thousand;
- Soprarno SGR S.p.A., in the amount of EUR 64 thousand.
Income from available-for-sale funds
Income from available-for-sale funds was EUR 298 thousand (EUR 278 thousand in 2013) and came from capital gains from
distributions of venture capital funds.
Impairment of available-for-sale shareholdings and funds
The merger by incorporation of the subsidiary DeA Capital Investments S.A. took place on 14 November 2014. The fair value
measurement of the shareholding at pre-merger stage made it necessary to record impairment of EUR 190,246 thousand for
the investee company. This impairment was due to the distribution of reserves made by the investee company during the year,
totalling EUR 178,919 thousand.
DeA Capital - Annual financial statements for the year ending 31 December 2014
175
The fair value measurement of investments in funds at 31 December 2014, carried out based on the documents received and
the information available, made it necessary to record impairment of EUR 385 thousand in respect of the venture capital funds
and EUR 933 thousand for the closed-end mutual investment funds.
For these funds, the significant reduction below cost was considered clear evidence of impairment.
The fair value measurement of the equity investment in IDeA Capital Funds SGR S.p.A. at 31 December 2014, which was
based on the documents received and the information available, made it necessary to record impairment of EUR 1,903
thousand for the investee company.
The fair value measurement of the shareholding in Sigla at 31 December 2014, which was based on the documents received
and the information available, made it necessary to record impairment of EUR 884 thousand for the investee company.
9b - Service revenues
Income of EUR 1,869 thousand was reported in 2014 (EUR 1,132 thousand in 2012), attributable to the reimbursement of
costs or supply of services, in the following amounts:
- EUR 864 thousand to IDeA FIMIT SGR S.p.A.;
- EUR 409 thousand from IDeA Capital Funds SGR S.p.A.;
- EUR 349 thousand from De Agostini S.p.A.;
- EUR 124 thousand from IRE S.p.A.;
- EUR 60 thousand from DeA Capital Real Estate S.p.A.;
- EUR 30 thousand from GTECH S.p.A.;
- EUR 24 thousand from De Agostini Publishing S.p.A.;
- EUR 9 thousand from Innovation Real Estate Advisory S.r.l.
9c - Other revenues and income
Other revenues and income, totalling EUR 253 thousand (compared with EUR 172 thousand in 2013), related mainly to
directors’ fees from Générale de Santé S.A. of EUR 245 thousand.
10 - Operating costs
10a - Personnel costs
Personnel costs totalled EUR 4,978 thousand, compared with EUR 1,316 thousand in 2013.
The item breaks down as follows:
Financial year
Financial year
(EUR thousand)
2014
2013
Salaries and wages
1,526
1,740
Social security charges
338
264
Remuneration for the Board of Directors
149
110
Stock options figurative cost
937
884
Stock option reversal
(815)
(890)
End-of-service payment fund
106
25
Total personnel costs
2,737
290
Reversal of other personnel costs
0
(1,107)
Total
4,978
1,316
The effect of the cost arising from the stock option plans for 2014, of EUR 937 thousand (EUR 884 thousand in 2013), was
more than offset by the reversal of the cost allocated to the “Stock Options 2012-2014” reserve of EUR 815 thousand. The
Allocation Plan 2012-2014 is to be considered lapsed as the conditions for exercising option rights were not met.
176 DeA Capital - Notes to the financial statements
The Parent Company has 13 employees (14 at 31 December 2013).
The table below shows changes and the average number of Parent Company employees during the year.
(Euro thousand)
1.1.2014
Recruits
Departures
31.12.2014
Average no.
Senior managers
4
0
(1)
3
3
Senior managers on fixed-term
contracts
1
0
0
1
1
Junior managers
4
0
0
4
4
Staff
5
0
0
5
5
Total
14
0
(1)
13
13
Share-based payments
Employees of DeA Capital S.p.A. and the Parent Company, De Agostini S.p.A., are beneficiaries of stock option plans based
on the shares of DeA Capital S.p.A. Unexercised but valid call options on the Company’s shares at 31 December 2014 totalled
3,163,200 (2,643,200 at 31 December 2013).
Stock option plans were valued using the numerical binomial tree procedure (the original Cox, Ross and Rubinstein method).
Numerical analysis using binomial trees generates simulations of various possible developments in the share price in future
periods.
On 17 April 2014, the shareholders’ meeting approved the DeA Stock Option Plan 2014-2016. To implement the resolution
of the shareholders’ meeting, the Board of Directors voted (i) to implement the DeA Capital Stock Option Plan 2014-2016
approved by the shareholders’ meeting, vesting the Chairman of the Board of Directors and the Chief Executive Officer will all
necessary
powers, to be exercised severally and with full powers of delegation;
and (ii) to allocate a total of 1,550,000 options
to certain employees of the Company, its subsidiaries and of the parent company De Agostini S.p.A. who carry out important
roles for the Company.
In line with the criteria specified in the regulations governing the DeA Capital Stock Option Plan 2014-2016, the Board of
Directors also set the exercise price for the options allocated at EUR 1.320, which is the arithmetic mean of the official price
of ordinary DeA Capital shares on the Mercato Telematico Azionario, the Italian screen-based trading system organised and
managed by Borsa Italiana S.p.A., on the trading days between 17 March 2014 and 16 April 2014.
The options can be allocated to the beneficiaries, in one or more tranches, up to 31 December 2014 and exercised by
the latter, but in any case for an amount per tranche of not less than 25% of the options assigned to each, with effect
from the fifth calendar day following the date that the adjusted NAV figure at 31 December 2016 is announced, until 31
December 2019. The adjusted NAV means the value of the assets, net of liabilities, calculated on the basis of the company’s
balance sheet at 31 December 2016 and restated, where necessary, to take account of the measurement at fair value of all
investments, as assessed by an independent third party.
The shareholders’ meeting of 17 April 2014 also approved a paid capital increase, in divisible form, without option rights, via
the issue of a maximum of 2,000,000 ordinary shares to service the DeA Capital S.p.A. Stock Option Plan 2014-2016.
The shareholders also approved the adoption of the Performance Share Plan 2014-2016. On the same date, to implement
the shareholders’ resolution, the Board of Directors of DeA Capital S.p.A. voted (i) to launch the DeA Capital Performance
Share Plan 2014-2016 approved by the shareholders’ meeting, vesting the Chairman of the Board of Directors and the Chief
Executive
Officer with all the necessary powers, to be exercised severally and
with full power of delegation; and (ii) to allocate
a total of 393,500 units (representing the right to receive ordinary shares in the Company free of charge, under the terms and
conditions of the plan) to certain employees of the Company, its subsidiaries and of the parent company De Agostini S.p.A.
who carry out important roles for the Company.
The shares allocated due to the vesting of units will be drawn from the Company’s existing treasury shares so that the
allocation will not have a nominally dilutive effect.
DeA Capital - Annual financial statements for the year ending 31 December 2014
177
The shareholders’ meeting also approved the Company’s Remuneration Policy pursuant to art. 123-ter of the Consolidated
Finance Law.
The terms and conditions of the Stock Option Plan 2014-16 and the Performance Share Plan 2014-16 are described in
the Information Prospectus prepared in accordance with art. 84-bis of Consob Resolution 11971 of 14 May 1999 (Issuer
Regulations), available to the public at the registered office of DeA Capital S.p.A. and on the Company’s websitewww.
deacapital.it (in the section Corporate Governance/Incentive Plans).
10b - Service costs
The table below shows a breakdown of service costs, which came in at EUR 4,819 thousand in 2014 (EUR 4,110 thousand
in 2013):
Financial year
Financial year
(EUR thousand)
2014
2013
Management, tax, legal consultancy and other fees
1.626
1.524
Fees to corporate bodies
278
276
Ordinary maintenance
105
138
Travel expenses
98
114
Utilities and general expenses
2.577
1.895
Bank charges
24
30
Advertising, conferences, online subscriptions, office supplies
99
101
Other charges
12
32
Total
4.819
4.110
10c - Depreciation and amortisation
Please see the table on changes in intangible and tangible assets for details on this item.
10d - Other charges
This item totalled EUR 444 thousand (EUR 213 thousand in 2013) and mainly comprises registration tax and the non-
deductible portion of VAT as a result of applying the percentage of 64% against which VAT on purchases made during the year
may be offset.
178 DeA Capital - Notes to the financial statements
11 - Financial income and charges
11a - Financial income
IFinancial income totalled EUR 3,173 thousand (EUR 3,647 thousand in 2013) and included interest income of EUR 892
thousand, income from the cancellation of the payable to the seller of FARE Holding of EUR 2,206 thousand, and exchange rate
gains of EUR 75 thousand.
A breakdown of interest income shows that EUR 11 thousand was earned on bank current accounts, EUR 862 thousand on
loans to subsidiaries and EUR 19 thousand on loans to associated companies.
Financial year
Financial year
(EUR thousand)
2014
2013
Interest income
892
2,587
Financial liabilities adjustment
2,206
0
Income from financial instruments available for sale
0
0
Income from financial instruments at fair value through income statement
0
1,018
Exchange gains
75
42
Total
3,173
3,647
11b - Financial charges
Financial charges totalled EUR 3,443 thousand, compared with EUR 4,776 thousand in 2013. These mainly included interest
payable on loans and financial liabilities and losses on hedging derivatives and exchange rates.
Specifically, financial charges mainly break down as follows:
- negative adjustment following the discounting to present value of the end-of-service provisions accrued in 2014, of
EUR 14 thousand;
- interest payable on loans granted by DeA Capital Investments S.A. of EUR 152 thousand;
- interest payable on the Mediobanca and Intesa SanPaolo S.p.A. credit line of EUR 2,750 thousand and fees of
EUR 519 thousand.
Financial year
Financial year
(EUR thousand)
2014
2013
Interest expense
3,421
3,314
Charges on financial liabilities
14
239
Charges on derivatives and securities
0
827
Exchange losses
8
396
Total
3,443
4,776
12 - Tax
12a - Income tax for the period
At 31 December 2014, no IRAP taxes were recorded because of the negative tax base. This item mainly includes current tax
income, amounting to EUR 911 thousand, which relates to the decision by DeA Capital S.p.A. (previously B&D Holding di Marco
Drago e C.S.a.p.A.) to join the national tax consolidation scheme of the De Agostini S.p.A. Group.
DeA Capital - Annual financial statements for the year ending 31 December 2014
179
12b - Deferred tax assets and liabilities
This item came in at EUR 6,757 thousand and consists entirely of provisions for deferred tax assets during the year.
The table below shows a reconciliation of the tax charges recorded in the Financial Statements and the theoretical tax charge
calculated using the IRES rate applicable in Italy:
31.12.2014
31.12.2013
(EUR thousand)
Amount
Rate
Amount
Rate
Profit before tax
(12,185)
(66,600)
Tax on theoretical income
(3,351)
27.50%
(18,315)
27.50%
Tax effect of permanent differences
- Write-downs on equity investments
53,156
-436.24%
53,653
-80.56%
- Dividends
(52,045)
427.12%
(36,789)
55.24%
- Non-deductible interest
635
-5.21%
458
-0.69%
- Other changes
157
-1.29%
128
-0.19%
Income from tax consolidation scheme (interest)
(546)
4.48%
(1,979)
2.97%
Adjustment to income from tax consolidation
scheme of previous years
1,083
-8.89%
(30)
0.05%
Deferred tax assets
(6,757)
55.45%
(808)
1.21%
Other net differences
0
0.00%
(53)
0.08%
Other taxes on foreign income
3
-0.02%
0
0.00%
Income tax reported in the
income statement
(7,665)
(3,735)
13 - Basic earnings (loss) per share
Basic earnings per share are calculated by dividing net profit or loss for the period attributable to the parent company by the
weighted average number of ordinary shares outstanding during the period.
Diluted earnings per share are calculated by dividing net profit for the period attributable to shareholders by the weighted
average number of ordinary shares outstanding during the period, including any dilutive effects of stock options.
The table below shows the share information used to calculate basic and diluted earnings per share:
Financial year
Financial year
(EUR thousand)
2014
2013
Parent Company profit/(loss)(A)
(4.519.219)
(62.866.203)
Weighted average number of ordinary shares outstanding (B)
273.806.403
273.994.870
Basic earnings/loss per share (EUR per share) (C=A/B)
(0,0165)
(0,2294)
Adjustment for dilutive effect
-
-
Net profit/(loss) adjusted for diluted effect (D)
(4.519.219)
(62.866.203)
Weighted average number of shares to be issued for the
exercise of stock options (E)
306.445
-
Total number of shares outstanding and to be issued (F)
274.112.848
273.994.870
Diluted earnings/loss per share (EUR per share) (G=D/F)
(0,0165)
(0,2294)
Options have a dilutive effect only when the average market price of the share for the period exceeds the strike price of the
options or warrants (i.e. when they are “in the money”).
180 DeA Capital - Notes to the financial statements
Other information
Commitments
At 31 December 2014, residual commitments to make paid calls to funds totalled EUR 107.7 million, compared with EUR 76.4
million in 2013.
Changes in commitments are shown in the table below.
(EUR m)
Residual commitments to funds - 31.12.2013
104.8
Distributions reclassified from callable to non-callable
(1.2)
Change in commitmentsof VC funds
0.1
New commitments
21.1
Capital Calls
(18.6)
Exchange differences
0.3
Residual commitments to funds - 31.12.2014
106.5
Treasury shares and Parent Company shares
On 17 April 2014, the shareholders’ meeting authorised the Board of Directors to buy and sell, on one or more occasions, on a
rotating basis, a maximum number of ordinary shares in the Company representing a stake of up to 20% of its share capital.
The plan replaces the previous plan approved by the shareholders’ meeting on 19 April 2013 (which was scheduled to expire
with the approval of the 2013 Annual Financial Statements), and will pursue the same objectives as the previous plan, including
purchasing treasury shares to be used for extraordinary transactions and share incentive schemes, offering shareholders a
means
of monetising their investment, stabilising the share price and
regulating trading within the limits of current legislation.
The authorisation specifies that purchases may be carried out up to the date of the shareholders’ meeting to approve the
Financial Statements for the Year Ending 31 December 2014 and, in any case, not beyond the maximum duration allowed by
law, in accordance with all the procedures allowed by current regulations, and that DeA Capital S.p.A. may also sell the shares
purchased for the purposes of trading, without time limits. The unit price for the purchase of the shares will be set on a case-
by-case basis by the Board of Directors, but must not be more than 20% above or below the share’s reference price on the
trading
day prior to each purchase. In contrast, the authorisation to sell
treasury shares already held in the Company’s portfolio,
and any shares bought in the future, was granted for an unlimited period, to be implemented using the methods considered
most appropriate and at a price to be determined on a case-by-case basis by the Board of Directors, which must not, however,
be more than 20% below the share’s reference price on the trading day prior to each individual sale (apart from in certain
exceptional cases specified in the plan). Sale transactions may also be carried out for trading purposes.
On the same date, the Board of Directors voted to launch the plan to buy and sell treasury shares authorised by the
shareholders’
meeting, and to this end vested the Chairman of the Board of Directors
and the Chief Executive Officer with all the
necessary powers, to be exercised severally and with full powers of delegation.
In 2014, as a part of the above plans, DeA Capital S.p.A. purchased 2,348,732 shares valued at approximately EUR 3,719,532
(at an average price of EUR 1.584 per share).
Taking into account purchases made in previous years for plans in place from time to time, and the use of treasury shares to
service acquisitions of controlling interests in FARE Holding and IDeA AI, at 31 December 2014 the Company owned 34,985,736
treasury shares (equal to about 11.4% of the share capital).
As of the date of this document, based on purchases of 2,383,540 shares made after the end of 2014, the Company had a total
of 37,369,276 treasury shares corresponding to about 12.2% of the share capital.
During 2014, the Company did not hold, purchase or sell, on its own account or through a trust company, any shares in the
Parent Company De Agostini S.p.A.
DeA Capital - Annual financial statements for the year ending 31 December 2014
181

Stock Option and Performance Share Plans
On 17 April 2014, the shareholders’ meeting approved the DeA Stock Option Plan 2014-2016. To implement the resolution
of the shareholders’ meeting, the Board of Directors voted (i) to implement the DeA Capital Stock Option Plan 2014-2016
approved by the shareholders’ meeting, vesting the Chairman of the Board of Directors and the Chief Executive Officer will all
necessary
powers, to be exercised severally and with full powers of delegation;
and (ii) to allocate a total of 1,550,000 options
to certain employees of the Company, its subsidiaries and of the Parent Company De Agostini S.p.A. who carry out important
roles for the Company.
In line with the criteria specified in the regulations governing the DeA Capital Stock Option Plan 2014-2016, the Board of
Directors also set the exercise price for the options allocated at EUR 1.320, which is the arithmetic mean of the official price
of ordinary DeA Capital shares on the Mercato Telematico Azionario, the Italian screen-based trading system organised and
managed by Borsa Italiana S.p.A., on the trading days between 17 March 2014 and 16 April 2014.
The shareholders’ meeting of 17 April 2014 also approved a paid capital increase, in divisible form, without option rights, via
the issue of a maximum of 2,000,000 ordinary shares to service the DeA Capital S.p.A. Stock Option Plan 2014-2016.
The shareholders also approved the adoption of the Performance Share Plan 2014-2016. On the same date, to implement
the shareholders’ resolution, the Board of Directors of DeA Capital S.p.A. voted (i) to launch the DeA Capital Performance
Share Plan 2014-2016 approved by the shareholders’ meeting, vesting the Chairman of the Board of Directors and the Chief
Executive
Officer with all the necessary powers, to be exercised severally and
with full power of delegation; and (ii) to allocate
a total of 393,500 units (representing the right to receive ordinary shares in the Company free of charge, under the terms and
conditions of the plan) to certain employees of the Company, its subsidiaries and of the Parent Company De Agostini S.p.A.
who carry out important roles for the Company.
The shares allocated due to the vesting of units will be drawn from the Company’s existing treasury shares so that the
allocation will not have a nominally dilutive effect.
The shareholders’ meeting also approved the Company’s Remuneration Policy pursuant to art. 123-ter of the Consolidated
Finance Law.
The tables below summarise the assumptions made in calculating the fair value of the plans:
Stock Option
plan 2004
plan 2005
plan 2012
plan 2013
plan 2014
No. of options allocated
160,000
180,000
1,030,000
1,550,000
1,550,000
Average market price at
allocation date
2.445
2.703
1.38
1.26
1.44
Value at allocation date
391,200
486,540
1,421,400
1,953,000
2,232,000
Average exercise price
2.026
2.459
1.3363
1.289
1.32
Expected volatility
31.15%
29.40%
33.84%
32.94%
31.63%
Option expiry date
31/08/15
30/04/16
31/12/17
31/12/18
31/12/19
Risk-free rate
4.25%
3.60%
2.47%
1.55%
1.56%
The Allocation Plan 2012-2014 is to be considered lapsed as the conditions for exercising option rights were not met.
182 DeA Capital - Notes to the financial statements

Plan
Plan
Plan
Performance share
2012
2013
2014
No. of options allocated
302,500
393,500
393,500
Average market price at allocation date
1,380
1,260
1,44
Value at allocation date
417,450
495,810
566,640
Expected volatility
33.84%
32.94%
31.63%
Option expiry date
31/12/14
31/12/15
31/12/16
Risk-free yield
2.47%
1.55%
1.56%
Transactions with parent companies, subsidiaries and related parties
Intercompany relationships with the Parent Company and its Groups
Transactions with related parties, including intercompany transactions, are typical, usual transactions that are part of the
normal business activities of Group companies. Such transactions are concluded at standard market terms for the nature of
the goods and/or services offered.
With regard to transactions with parent companies, note the following:
1) DeA Capital S.p.A. signed a service agreement with the controlling shareholder, De Agostini S.p.A., for the latter to provide
operating services in the administration, finance, control, legal, corporate and tax areas.
This agreement, which is renewable annually, is priced at market rates, and is intended to allow the Company to maintain a
streamlined organisational structure in keeping with its development policy, while obtaining sufficient operational support.
At the same time, on 1 January 2013, DeA Capital S.p.A. signed an “Agreement to sub-let property for intended use other
than residential use” with the controlling shareholder, De Agostini S.p.A. The agreement relates to parts of a building
located at Via Brera, 21, Milan, comprising space for office use, warehousing and car parking.
This agreement, which is renewable every six years after an initial term of seven years, is priced at market rates.
2) DeA Capital S.p.A., IDeA Capital Funds SGR S.p.A., DeA Capital Real Estate S.p.A. and I.F.IM. S.r.l. have adopted the
national tax consolidation scheme of the De Agostini Group (the Group headed by De Agostini S.p.A., formerly B&D Holding
di Marco Drago e C. S.a.p.a.). This option was exercised jointly by each company and De Agostini S.p.A. by signing the
“Regulation for participation in the national tax consolidation scheme for companies in the De Agostini Group” and notifying
the tax authorities of this option pursuant to the procedures and terms and conditions set out by law. The option is
irrevocable unless the requirements for applying the scheme are not met.
The option for DeA Capital S.p.A. is irrevocable for the three-year period 2014-2016.
3) In order to enable a more efficient use of liquidity and the activation of credit lines with potentially better terms and
conditions compared with those that may be obtained from banks, DeA Capital S.p.A. has signed a framework agreement
(Framework Agreement) with the Parent Company De Agostini S.p.A. for the provision of short-term intercompany loans.
Deposit/financing operations falling within this Framework Agreement shall only be activated subject to verification that
the terms and conditions determined at any time are advantageous, and will be provided on a revolving basis, and with
maturities of not more than three months. The Framework Agreement shall have a duration of one year and is renewable.
The amounts involved in the deposit/financing operations will, however, be below the thresholds defined for “transactions
of lesser importance” pursuant to Consob Regulation 17221/2010 (Transactions with Related Parties) and the internal
procedure on Transactions with Related Parties adopted by DeA Capital S.p.A.
Lastly, the Company did not hold, purchase or dispose of the shares of any related parties in 2014.
DeA Capital - Annual financial statements for the year ending 31 December 2014
183
The table below shows the balances arising from transactions with related parties.
31.12.2014
Financial year 2014
Revenues
Trade
Trade
Tax
Tax
Trade
for
Financial
Tax
Personnel
Service
(EUR thousand)
receivables receivables receivables
payables
payables
services
income
income
costs
costs
Sigla S.r.l.
-
1.709,6
-
-
-
-
17,3
-
-
-
IDeA Real Estate
S.p.A.
-
-
-
-
-
-
-
-
-
-
IDeA Capital Funds
SGR S.p.A.
99,3
-
-
63,9
-
408,7
-
-
(40,0)
-
IDeA FIMIT SGR
S.p.A.
223,3
-
-
-
33,5
864,5
-
-
48,1
-
DeA Capital Real
Estate S.p.A.
-
-
-
-
-
59,8
-
-
(13,4)
-
Innovation Real
Estate S.p.A.
43,9
-
-
-
17,5
123,8
-
-
(25,0)
12,0
I.R.E. Advisory S.r.l.
-
-
-
-
-
9,0
-
-
93,5
-
DeA Investments
S.A.
-
-
-
-
25,0
-
-
-
-
-
De Agostini S.p.A.
147,1
-
3.444,0
339,7
-
349,2
-
911,0
120,0
490,0
De Agostini Libri
S.p.A.
-
-
-
-
1,9
-
-
-
-
2,1
De Agostini
Publishing Italia
S.p.A.
4,9
-
-
-
-
24,1
-
-
-
-
GTECH S.p.A.
38,6
-
-
-
29,4
-
-
-
De Agostini Editore
S.p.A.
-
-
-
-
42,4
-
-
-
-
128,4
Total related
parties
557,1
1.709,6
3.444,0
403,6
120,3
1.868,5
17,3
911,0
183,2
632,5
Total financial
statement line
item
557,0
1.709,6
3.733,4
587,9
1.325,4
1.868,5
3.171,5
911,0
4.978,2
4.818,9
as % of financial
statement line
item
100,0%
100,0%
92,2%
68,7%
9,1%
100,0%
0,5% 100,0%
3,7%
13,1%
In 2014, the pro-rata expenses for improvements to leased assets, incurred in the name of and on behalf of third parties, were
reimbursed and allocated as follows:
- EUR 139 thousand to IDeA FIMIT SGR S.p.A.;
- EUR 45 thousand to De Agostini S.p.A.;
- EUR 60 thousand to IDeA Capital Funds SGR S.p.A.;
- EUR 40 thousand to GTECH S.p.A.;
- EUR 11 thousand to IRE S.p.A.;
- EUR 3 thousand to De Agostini Publishing Italia S.p.A.
Remuneration: directors of the board, auditors, general managers and directors with
strategic responsibilities
In 2014, remuneration payable to the directors and auditors of DeA Capital S.p.A. for the performance of their duties totalled
EUR 300 thousand and EUR 175 thousand respectively.
184 DeA Capital - Notes to the financial statements

Remuneration paid to directors and auditors is shown in the table below:
Fees for
position at
company
Statutory
preparing
auditors’
the financial
Bonuses
fees for
Period
statements
and
positions
Other
position
Position
in EUR
Non-cash
other
held at
remuneration
Director
Position
held
expires
thousand
benefits
incentives subsidiaries
EUR/000
Approval fin.
statements
Lorenzo Pellicioli
Chairman
2014
2015
30
0
0
0
0
Approval fin.
Chief Executive
statements
Paolo Ceretti
Officer
2014
2015
30
0
0
0
73
Approval fin.
statements
Lino Benassi
Director
2014
2015
30
0
0
0
112
To 12 March
Stefania Boroli
Director
2014
2015
30
0
0
0
0
Approval fin.
statements
Rosario Bifulco
Director
2014
2015
30
0
0
0
25
Approval fin.
statements
Francesca Golfetto
Director
2014
2015
30
0
0
0
20
Approval fin.
statements
Roberto Drago
Director
2014
2015
30
0
0
0
0
Approval fin.
statements
Marco Drago
Director
2014
2015
30
0
0
0
0
Approval fin.
statements
Severino Salvemini
Director
2014
2015
30
0
0
0
35
Approval fin.
statements
Marco Boroli
Director
2014
2015
30
0
0
0
0
Chairman of
the Board
Approval fin.
of Statutory
statements
Angelo Gaviani
Auditors
2014
2015
75
0
0
9
0
Approval fin.
Permanent
statements
Gian Piero Balducci
Auditor
2014
2015
50
0
0
48
34
Approval fin.
Permanent
statements
Annalisa Donesana
Auditor
2014
2015
50
0
0
32
10
In contrast to the data contained in the Remuneration Report prepared pursuant to art. 123-ter of the TUF in accordance with
art. 84-quater of the Issuer Regulation, the emoluments and compensation indicated above do not include social security
contributions where applicable.
“Other remuneration” relates to remuneration received for other positions held in either DeA Capital S.p.A. or other Group
companies.
In 2014, annual salaries and bonuses, excluding benefits in kind, paid to managers with strategic responsibilities in the Parent
Company, totalled about EUR 621 thousand.
DeA Capital - Annual financial statements for the year ending 31 December 2014
185
Shareholdings held by directors, auditors, general managers and managers with strategic
responsibilities
Details of shareholdings held in DeA Capital S.p.A. and its subsidiaries by members of the boards of directors and auditors and
by managers with strategic responsibilities are provided in aggregate format in the table below.
No shareholdings were reported for general managers, since to date, this position does not exist.
All
those who held positions on the boards of directors or auditors, or as
managers with strategic responsibilities, for the whole
or part of the year in question, are included.
No. of shares
Investee
No. of shares No. of shares
No. of
held at 31
Name and surname
company
held at 1.1.14
purchased
shares sold December 2014
Lorenzo Pellicioli
DeA Capital S.p.A.
2,566,323
0
0
2,566,323
Paolo Ceretti
DeA Capital S.p.A.
1,000,000
0
0
1,000,000
Rosario Bifulco
DeA Capital S.p.A.
1,536,081
0
0
1,536,081
Lino Benassi
DeA Capital S.p.A.
23,500
0
0
23,500
Senior managers
with strategic
responsibilities
DeA Capital S.p.A.
105,000
100,000
0
205,000
Total
5,230,904
100,000
0
5,330,904
No DeA Capital shares are held by other directors or auditors who are currently in office; furthermore, no shares are held in
companies controlled by DeA Capital.
Directors Lorenzo Pellicioli, Marco Drago, Marco Boroli, Stefania Boroli (resigned on 12 March 2015) and Roberto Drago hold
treasury shares of B&D Holding di Marco Drago e C. S.a.p.A. and - in the case of directors Marco Drago, Roberto Drago,
Stefania Boroli (resigned on 12 March 2015) and Marco Boroli - shares of De Agostini S.p.A., which control the Company both
directly and indirectly, and are parties to a shareholders’ agreement covering these shares.
Stock options allocated to members of the boards of directors and auditors, general
managers and managers with strategic responsibilities
Details of stock options held by members of the boards of directors and auditors and by managers with strategic
responsibilities in DeA Capital S.p.A. and its subsidiaries are provided in aggregate format in the table below.
Options
Options held at
Options allocated
expired
Options held at
1 January 2014
during 2014
in 2014
31 December 2014
Average
Average
Average
No. exercise Average
No.
exercise Average
No.
No.
exercise Average
Beneficiary
Position
options
price
expiry options
price
expiry options options
price
expiry
Paolo Ceretti
CEO
630,000
1.3363
5
0
0
0 630,000
0
0
0
Paolo Ceretti
CEO
950,000
1.289
5
0
950,000
1.289
5
Paolo Ceretti
CEO
0
0
0
950,000
1.32
5
0
950,000
1.32
5
Senior managers
with strategic
responsibilities
400,000
1.3363
5
0
0
0 400,000
0
0
0
Senior managers
with strategic
responsibilities
600,000
1.289
5
0
0
0
0
600,000
1.289
5
Senior managers
with strategic
responsibilities
0
0
0
600,000
1.32
5
0
600,000
1.32
5
186 DeA Capital - Notes to the financial statements
Lastly, note that the Chief Executive Officer, Paolo Ceretti, and managers with strategic responsibilities were assigned 120,000
and 84,625 performance shares respectively in 2014, as shown in the table below:
Options
Options held at
Options allocated
expired
Options held at
1 January 2014
during 2014
in 2014
31 December 2014
Average
Average
Average
No. exercise Average
No.
exercise Average
No.
No.
exercise Average
Beneficiary
Position
options
price
expiry options
price
expiry options options
price
expiry
Paolo Ceretti
CEO
80,000
1.38
2
0
0
0
80,000
0
0
0
Paolo Ceretti
CEO
120,000
1.26
2
0
0
0
0
120,000
1.26
2
Paolo Ceretti
CEO
0
0
0
120,000
1.44
2
0
120,000
1.44
2
Senior managers
with strategic
responsibilities
52,500
1.38
2
0
0
0
52,500
0
0
0
Senior managers
with strategic
responsibilities
84,625
1.26
2
0
0
0
0
84,625
1.26
2
Senior managers
with strategic
responsibilities
0
0
0
84,625
1.44
2
0
84,625
1.44
2
Information on the “Fair Value Hierarchy”
IFRS 13 stipulates that financial instruments reported at fair value should be classified based on a hierarchy that reflects the
importance and quality of the inputs
used in calculating fair value. Three levels have been determined:
• level 1: includes quoted prices on active markets for assets or liabilities identical to those being valued;
• level 2: includes observable inputs other than those included in level 1, for example:
- quoted prices on active markets for similar assets and liabilities;
- quoted prices on inactive markets for identical assets and liabilities;
- interest rate curves, implicit volatility, credit spreads.
• level 3: unobservable data. These input data may be used if no observable input data are available. IFRS 13 specifies that
unobservable input data used to measure fair value must reflect the assumptions used by market participants when fixing
the price for the assets or liabilities being valued.
The table below shows assets valued at fair value by hierarchical level at 31 December 2014:
(EUR thousand)
Level 1
Level 2
Level 3
Total
Investments in subsidiaries
0.0
0.0
256.9
256.9
Investments in associates
0.0
3.0
11.2
14.2
Investments in avalaible for sale
0.0
209.1
0.2
209.3
Funds avalaible for sale
0.0
144.4
0.0
144.4
Total
0.0
356.5
268.3
624.8
DeA Capital - Annual financial statements for the year ending 31 December 2014
187

A reconciliation of the opening and closing balances is shown in the table below for level 3. Income and expenses posted to the
income statement or shareholders’ equity, and purchases and sales made during 2014 are identified separately.
Balance at
Distribuzione
Fair value
Balance at
(EUR thousand)
1.1.2014
Increases Decreases Restatements
S.A.
Mergers Impairment adjustment
31.12.2014
Subsidiaries
DeA Capital
Investments S.A.
385,202
0
0
0
0
(194,956)
(190,246)
0
0
DeA Capital Real
Estate S.p.A.
89,300
0
0
0
0
60,430
0
(4,650)
145,080
I.F.IM. S.r.l.
60,430
0
0
0
0
(60,430)
0
0
0
IDeA Opportunity
Fund I
0
2,399
(5,077)
979
56,359
0
0
1,311
55,971
IDeA FIMIT SGR
S.p.A.
5,835
0
0
0
0
0
0
104
5,939
IDeA Capital
Funds SGR S.p.A.
51,813
0
0
0
0
0
(1,903)
0
49,910
Associates
Sigla Luxembourg
S.A.
0
0
0
0
12,085
0
0
(884)
11,201
Other investments
Harvip
Investimmenti
S.p.A.
184
0
0
0
0
0
0
0
184
Total
592,764
2,399
(5,077)
979
68,444
(194,956)
(192,149)
(4,119)
268,285
Valuation techniques and main unobservable input data
Subsidiaries
Valuations of shareholdings and funds in the portfolio reflect estimates made using the information available on the date this
document was prepared.
Equity investments are valued using calculation methodologies based on specific assumptions concerning:
• the growth of future cash flows contingent upon future events that can be assigned probabilities based on historical
experience;
• the level of specific input parameters that are not listed on active markets; in all cases, the prices and spreads observed in
the market are preferred for estimating these
IDeA FIMIT SGR
The economic value of the subsidiary IDeA FIMIT SGR was estimated with the help of a specific report by an independent
expert. The report was based on the sum of the parts model and calculated the value, defined as the sum of (i) the present
value of dividend flows (DDM method) expected from IDeA FIMIT SGR and (ii) the present value of the carried interest flows
expected from the same company (DCF method), both for the forecasting period in question (2015-2017) and future periods
(using a projected terminal value based on normalised cash flows).
A number of assumptions were used in determining these flows, including estimates of future increases in revenues, based on
expected trends in managed assets, EBITDA and net income, or in the case of carried interest, on the basis of the company’s
projections of future returns for the various funds under management.
The valuation was based on a cost of capital of +9.5% plus a terminal value based on growth (“g”) assumptions of +1.0%.
188 DeA Capital - Notes to the financial statements

Sensitivity
analysis performed on the most significant variables in terms of
sensitivity to the value of IDeA FIMIT SGR, i.e. the
risk-free rate and the rate of growth (g) used, leads to a potential change in the company’s overall value of EUR -8.5/+9.7
million (for changes of +0.5% and -0.5% in the discount rate) and EUR -7.1/+8.0 million (for changes of -0.5% and +0.5% in
the rate of growth (g)).
DeA Capital Real Estate
The economic value of the subsidiary DeA Capitale Real Estate was estimated on the basis of an internal valuation, which
mainly includes the valuation of the investment in IDeA FIMIT SGR, as described in the previous section.
IDeA Capital Funds SGR
The economic value of the subsidiary IDeA Capital Funds SGR was estimated with the help of a specific report by an independent
expert. The report was based on the sum of the parts model and calculated the value, defined as the sum of (i) the current value
of dividend flows (DDM method) expected from IDeA Capital Funds SGR and (ii) the current value of the carried interest flows
expected from the same company (DCF method), both for the forecasting period in question (2015-2017) and future periods
(using a projected terminal value based on normalised cash flows).
A number of assumptions were used in determining these flows, including estimates of future increases in revenues, based on
expected trends in managed assets, EBITDA and net income, or in the case of carried interest, on the basis of IRR projections
made by the company for the various funds under management.
The valuation was based on a cost of capital of between 10.4% and 11.7%, depending on (i) the period of the flows (2015-2017
or later) and (ii) the nature of these flows (dividends from the asset management company or carried interest from the managed
funds), supplemented by a terminal value based on a growth assumption of 1.0%.
Sensitivity analysis performed on the most significant variables in terms of sensitivity to the value of IDeA Capital Funds SGR,
i.e.
the risk-free rate and the rate of return for the managed funds used,
leads to a potential change in the carrying value of EUR
-2.1/+2.5 million (for changes of +0.5% and -0.5% in the risk-free rate) and EUR -1.8/+1.9 million (for changes of -1.5% and
+1.5% in the expected IRR rate on the managed funds).
Kenan Investments/Migros
The shareholding in Kenan Investments (the indirect parent company of Migros) is recorded in the Consolidated Financial
Statements for the Year Ending 31 December 2014 at EUR 209.1 million.
The valuation of the shareholding in Kenan Investments at 31 December 2014, calculated on the basis of the percentage
owned by DeA Capital S.p.A., is based on a stock price of Migros, whose shares are listed on the Istanbul Stock Exchange, of:
(iii)
TRY 26.00 for the stake in Migros that is the subject of the
transaction with Anadolu (described in the section ‘Significant
Events’ above), i.e. both the 40.25% of Migros shares being sold immediately and the 9.75% of Migros shares subject to
put and call options agreed by the parties);
(iv) TRY 22.75, being the market price on 31 December 2014, for the remaining stake (30.5% of Migros capital);
and, in addition to the exchange rate effect of TRY/EUR (2.83 at 31 December 2014), on an updated view of net debt at the
various levels of the Company’s control structure (Kenan Investments, Moonlight Capital, MH).
DeA Capital - Annual financial statements for the year ending 31 December 2014
189

Venture capital funds, funds of funds, co-investment fund, theme funds and property funds
Valuations of shareholdings and funds in the portfolio reflect estimates made using the information available on the date this
document was prepared.
With regard to funds, at 31 December 2014, the DeA Capital Group held units in:
• seven venture capital funds (with a total value of approximately EUR 9.6 million);
• IDeA I FoF (valued at EUR 93.5 million);
• ICF II (valued at EUR 35.2 million);
• ICF III (valued at EUR 1.7 million);
• IDeA EESS (valued at EUR 4.3 million);
• IDeA ToI (value not significant);
• IDeA OF I (valued at EUR 56.0 million);
• AVA Fund (valued at EUR 3.0 million).
The carrying value of the funds represents the NAV advised by the management company in its annual report at 31 December
2014, drafted in accordance with the Bank of Italy’s regulation of 14 April 2005 on collective asset management, as amended
and supplemented by the Bank of Italy’s regulation of 8 May 2012.
Management and coordination
The Parent Company is subject to the management and coordination of De Agostini S.p.A.
Key figures from the latest approved Financial Statements of De Agostini S.p.A. are shown below.
(in EUR)
INCOME STATEMENT
2013
2012
Revenues
4,670,254
327,050
Cost of production
(63,003,708)
(2,153,253)
Financial income and charges
78,497,618
17,183,719
Adjustments to value of financial assets
4,935,778
0
Extraordinary income and charges
(68,798)
(24,076)
Taxes for the year
10,728,946
467,307
Net profit
35,760,090
15,800,747
STATEMENT OF FINANCIAL POSITION
2013
2012
Unpaid subscribed capital
0
0
Non-current assets
3,229,406,987
2,401,637,583
Current assets
399,854,115
114,112,569
Accruals and deferrals
9,790,449
28
Shareholders’ equity
(2,691,130,778)
(2,324,711,398)
Provisions for risks and charges
(59,222,561)
0
End-of-service payment provision
(791,322)
0
Payables
(883,405,679)
(191,035,987)
Accruals and deferrals
(4,501,211)
(2,795)
190 DeA Capital - Notes to the financial statements

Risks
As described earlier in the Report on Operations, the Company operates through, and is structured as, two business areas,
Private Equity Investment and Alternative Asset Management.
The risks set out below stem from a consideration of the characteristics of the market and the Company’s operations, and the
main findings of a risk assessment, and from periodic monitoring, including that carried out through the regulatory policies
adopted by the Group. There could, however, be risks that are currently unidentified or not considered significant that could
have an impact on the Company’s operations.
The company has adopted a modern corporate governance system that provides effective management of the complexities
of its operations and enables its strategic objectives to be achieved. Furthermore, the assessments conducted by the
organisational units and the directors confirm both the non-critical nature of these risks and uncertainties and the financial
solidity of the Company.
A. Contextual risks
A.1. Risks relating to general economic conditions
The operating performance and financial position of the company are affected by the various factors that make up the macro-
economic environment, including increases or decreases in GDP, investor and consumer confidence, interest rates, inflation,
the costs of raw materials and unemployment.
The ability to meet medium- to long-term objectives could be affected by general economic trends, which could slow the
development of sectors the Group has invested in, and at the same time, the business of the investee companies.
A.2. Socio-political events
In line with its strategic growth guidelines, one of the Company’s activities is private equity investment in companies and
funds
in different jurisdictions and countries around the world, which, in
turn, invest in a number of countries and geographical
areas. The Company may have invested directly and indirectly in foreign countries whose social, political and economic
conditions put the achievement of its investment objectives at risk.
A.3. Regulatory changes
Many of the Company’s investee companies conduct their operations in highly regulated sectors and markets. Any changes to
or developments in the legislative or regulatory framework that affect the costs and revenues structure of investee companies
or the tax regime applied, could have negative effects on the company’s financial results, and necessitate changes in the
Company’s strategy.
To combat this risk, the Company has established procedures to constantly monitor sector regulation and any changes thereto,
in order to seize business opportunities and respond to any changes in the prevailing legislation and regulations in good time.
A.4. Performance of the financial markets
The Company’s ability to meet its strategic and management objectives could depend on the performance of public markets.
A negative trend on the public markets could have an effect on the private equity sector in general, making investment and
divestment transactions more complex, and on the Company’s ability to increase the NAV of investments in particular.
The value of shareholdings held directly or indirectly through funds in which the Company has invested could be affected by
factors such as comparable transactions concluded on the market, sector multiples and market volatility.
These factors that cannot be directly controlled by the Company are constantly monitored in order to identify appropriate
response strategies that involve both the provision of guidance for the management of investee companies, and the
investment and value enhancement strategy for the assets held.
A.5. Exchange rates
Holding investments in currencies other than the euro exposes the Company to changes in exchange rates between currencies.
DeA Capital - Annual financial statements for the year ending 31 December 2014
191

A.6. Interest rates
Ongoing financing operations that are subject to variable interest rates could expose the Company to an increase in related
financial charges, in the event that the reference interest rates rise significantly.
The
Company has established appropriate strategies to hedge against the
risk of fluctuations in interest rates. Given the partial
hedge of the underlying, the Company classifies these securities as speculative instruments, even though they are put in place
for hedging purposes.
B. Strategic risks
B.1. Concentration of the Private Equity investment portfolio
The private equity investment strategy adopted by the company includes:
- Direct investments;
- Indirect investments (in funds).
Within this strategy, the Company’s overall profitability could be adversely affected by an unfavourable trend in one or a few
investments,
if there were insufficient risk diversification, resulting from the
excessive concentration of investment in a small number
of
assets, sectors, countries, currencies or of indirect investments in
funds with limited investment targets/types of investment.
To combat these risk scenarios, the Company pursues an asset allocation strategy intended to create a balanced portfolio with
a
moderate risk profile, investing in attractive sectors and in companies
with an appealing current and future risk/return ratio.
Furthermore, the combination of direct and indirect investments, which by their nature provide a high level of diversification,
helps reduce the level of asset concentration.
B.2. Concentration of Alternative Asset Management activities
In the Alternative Asset Management business, events could arise as a result of excessive concentration that would hinder the
achievement of the level of expected returns. These events could be due to:
• Private equity funds
- concentration of the management activities of asset management companies across a limited number of funds, in the event
that one or more funds decides to cancel its asset management mandate;
- concentration of the financial resources of the funds managed in a limited number of sectors and/or geographical areas, in the
event of currency, systemic or sector crises;
- for closed-end funds, the concentration of commitment across just a few subscribers.
• Real estate funds
- concentration of real estate present in the portfolio of managed funds in a few cities and/or in limited types of property
(management/commercial), in the event of a crisis on the property market concerned;
-
concentration in respect of certain major tenants, in the event that
these withdraw from the rental contracts, which could lead
to a vacancy rate that has a negative impact on the funds’ financial results and the valuation of the property managed;
- concentration of the maturities of numerous real estate funds within a narrow timeframe, with the related high availability of
property on the market, leading to a decrease in property values and an increase in selling times.
For each of the risk scenarios outlined above, the Company has defined and implemented appropriate strategies that include
strategic, operational and management aspects, as well as a system monitoring the level of diversification of Alternative Asset
Management assets.
B.3. Key resources (governance/organisation)
The Company’s success depends to a large extent on its executive directors and key management figures, their ability to
efficiently manage the business and the normal activities of individual Group companies, as well as knowledge of the market
and the professional relationships established.
The departure of one or more of these key resources, without a suitable replacement being found, as well as any inability
to attract and retain new and qualified resources, could impact growth targets and have a negative effect on the Group’s
operating performance and financial results.
192 DeA Capital - Notes to the financial statements

To mitigate this risk, the Group has put in place HR management policies that correspond closely to the needs of the business,
and incentive policies that are periodically reviewed, in light of, among other things, the general economic climate and the
results achieved by the Group.
C. Operating risks
C.1. Investment operations
Investment operations conducted by the Company are subject to the risks typical of private equity activities, such as an
accurate valuation of the target company and the nature of the transactions carried out, which require the acquisition of
strategic shareholdings, but not controlling interests, governed by appropriate shareholders’ agreements.
The Company implements a structured process of due diligence on target companies, which requires the involvement of the
different levels of Group management concerned and the careful definition of shareholders’ agreements in order to make sure
that agreements are in line with the investment strategy and the risk profile defined by the company.
C.2. Compliance with covenants
Some investment operations were concluded using financial leverage to invest in the target companies. For financing contracts
signed by investee companies, specific covenants backed by real guarantees are in place; failure to comply with these could
require investee companies to carry out recapitalisation operations and lead to an increase in financial charges associated with
debt refinancing. Failure to comply with covenants attached to loans could have negative effects on both the financial situation
and operations of investee companies, and on the value of the investment.
The Company constantly monitors the significant reference parameters for the financial obligations taken on by investee
companies, in order to identify any unexpected variance in good time.
C.3. Divestment operations
The Company invests over a medium- to long-term horizon.
Over the investment management period, external situations could arise that might have a significant impact on the operating
results of the investee companies, and consequently on the value of the investment itself. Furthermore, in the case of co-
investment, guiding the management of an investee company could prove problematic or unfeasible, and it may ultimately
prove impossible to dispose of the stakes held owing to lock-up clauses.
The divestment strategy could therefore be negatively affected by various factors, some of which cannot be foreseen at
the time the investments are made. There is therefore no guarantee that expected earnings will be realised given the risks
resulting from the investments made.
To combat these risk situations, the Company has defined a process to monitor the performance of its investee companies,
facilitated by its representation on the management bodies of significant investee companies, with a view to identifying any
critical situations in good time.
C.4. Funding Risk
The income flows expected from the Alternative Asset Management business depend on the capacity of the ability of the asset
management companies in which the Company invests to stabilise/grow their assets under management.
In this environment, fundraising activity could be harmed by both external factors, such as the continuation of the global
economic
crisis or the trend in interest rates, and internal factors, such as
bad timing in respect of fundraising activities by the
asset management companies, or the departure of key managers from the companies.
The Company has established appropriate risk management strategies in relation to fund raising, with a view to both involving
new investors and retaining current investors.
DeA Capital - Annual financial statements for the year ending 31 December 2014
193

Significant events after the end of 2014
Private equity funds - paid calls/distributions
After the end of 2014, the Company increased its investments in the IDeA I FoF, IDeA ICF II, IDeA OF I, IDeA EESS, IDeA
ICF III and Atlantic Value Added funds following total payments of EUR 9,223 thousand (EUR 5,212 thousand, EUR 1,529
thousand, EUR 326 thousand, EUR 1,342 thousand, EUR 44 thousand and EUR 770 thousand, respectively).
At the same time, DeA Capital received capital reimbursements from the IDeA I FoF and IDeA ICF II funds of EUR 13,602
thousand and EUR 1,632 thousand respectively, to be used in full to reduce the value of the units.
Further information
In accordance with the provisions of IAS 10, the Company authorised the publication of these Financial Statements within the
terms set by the laws in force.
Atypical or unusual transactions
In 2014, there were no atypical or unusual transactions as defined by Consob Communication 6064293 of 28 July 2006.
Significant non-recurring events and transactions
In 2014, the Company did not undertake any significant non-recurring transactions as defined by the above-mentioned Consob
Communication.
194 DeA Capital - Notes to the financial statements

Statement of
responsibilities for
the annual financial
statements pursuant
to article 154-bis of
Legislative Decree 58/98
DeA Capital - Annual financial statements for the year ending 31 December 2014
195

Statement of responsibilities for the Annual Financial Statements
pursuant to article 154-bis of Legislative Decree 58/98
The undersigned, Paolo Ceretti, as Chief Executive Officer, and Manolo Santilli, as the manager responsible for preparing the
accounting statements, hereby certify, pursuant to art. 154-bis, paragraphs 3 and 4 of Legislative Decree 58 of 24 February
1998, that based on the characteristics of the Company, the administrative and accounting procedures for preparing the
Annual Financial Statements during the year were suitable, and were effectively applied.
The assessment as to the suitability of the administrative and accounting procedures for preparing the Financial Statements
for the Year Ending 31 December 2014 was based on a process established by DeA Capital S.p.A. in keeping with the Internal
Control - Integrated Framework model issued by the Committee of Sponsoring Organisations of the Treadway Commission,
which is the generally accepted reference framework at the international level.
Note in this regard, that as described in the notes to the Annual Financial Statements, a significant portion of the assets
are investments stated at fair value. Fair values were determined by directors based on their best estimate and judgment
using the knowledge and evidence available at the time the Financial Statements were prepared. However, due to objective
difficulties in making assessments and the absence of a liquid market, the values assigned to such assets could differ, and in
some cases significantly, from those that could be obtained when the assets are sold.
The undersigned further certify that the Annual Financial Statements for the Year Ending 31 December 2014:
- correspond to the Company’s accounting records;
- have been prepared in compliance with the International Financial Reporting Standards adopted by the European Union, and
the measures issued to implement art. 9 of Legislative Decree 38/2005;
-
to the best of their knowledge, provide a true and fair view of the
operating performance and financial position of the issuer.
The Report on Operations contains a reliable analysis of operating performance and results and of the position of the issuer
and all companies included in the basis of consolidation, together with a description of the main risks and uncertainties to
which they are exposed.
12 March 2015
Paolo Ceretti
Manolo Santilli
Chief Executive Officer
Manager responsible for preparing
the Company’s accounts
196 Statement of responsibilities for the annual financial statements pursuant to article 154-bis of Legislative Decree 58/98

Information pursuant to art. 149-duodecies of the Consob
Issuer Regulations
The table below was prepared in accordance with art. 149-duodecies of the Consob Issuer Regulations and reports the fees for
2014 for auditing and other services provided by the independent auditors and entities belonging to the independent auditors’
network. The fees reported below do not include VAT and out-of-pocket expenses.
Company providing
Compensation
(EUR thousand)
the service
Beneficiary
paid for FY 2014
Audit
KPMG S.p.A.
DeA Capital S.p.A.
98
Certification services (1)
KPMG S.p.A.
DeA Capital S.p.A.
7
Total
105
(1) Single model subscription/770
DeA Capital - Annual financial statements for the year ending 31 December 2014
197


Summary of Subsidiaries’
Financial Statements
to 31 December 2014
DeA Capital - Summary of Subsidiaries’ Financial Statements to 31 December 2014
199

DeA Capital
IDeA Capital
IDeA
Innovation
Innovation Real
(EUR thousand)
Real Estate
Funds SGR
FIMIT SGR
Real Estate
Estate Advisory
Non-current assets
62,335
902
230,281
2,922
13
Current assets
2,692
9,741
24,333
20,201
1,891
Available-for-sale financial assets -
non-current portion
-
-
-
-
-
Consolidated assets
65,026
10,643
254,613
23,123
1,905
Shareholders’ equity
60,867
5,804
219,671
6,116
1,242
Non-current liabilities
-
552
24,258
1,919
114
Current liabilities
4,160
4,287
10,685
15,088
549
Consolidated liabilities
65,026
10,643
254,613
23,123
1,905
Alternative Asset Management fees
-
14,432
54,116
-
-
Service revenues
19
-
-
18,697
1,957
Other investment income/charges
8,205
26
619
17
-
Other income
0
38
50
23
3
Personnel costs
(1,138)
(5,587)
(14,894)
(6,401)
(662)
External service costs
(3,308)
(3,113)
(11,983)
(7,554)
(439)
Amortisation/depreciation
-
(221)
(14,021)
(93)
(1)
Other charges
(5)
(2)
(6,236)
(197)
(1)
Financial income
13
202
363
8
0
Financial charges
-
(0)
(377)
(37)
(2)
Taxes
1,555
(2,170)
(3,251)
(1,591)
(293)
Profit/(loss) for the period from
held-for-sale operational assets
-
-
-
-
-
Net profit
5,342
3,605
4,387
2,871
561
200 Summary of Subsidiaries’ Financial Statements to 31 December 2014

Independent
Auditors’ Report
(Original available in
Italian version only)
DeA Capital - Independent Auditors’ Report
201


Report of the
Board of Statutory
Auditors
(Original available in
Italian version only)
DeA Capital - Report of the Board of Statutory Auditors
203